Cheat
Valgrind Memory and profiling
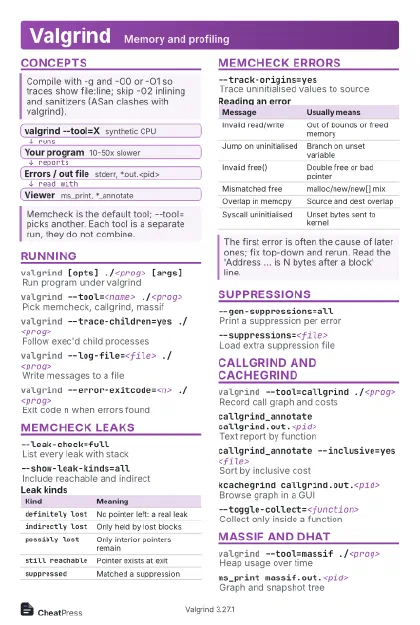 Light · Postcard
102 × 152 mm · PDF
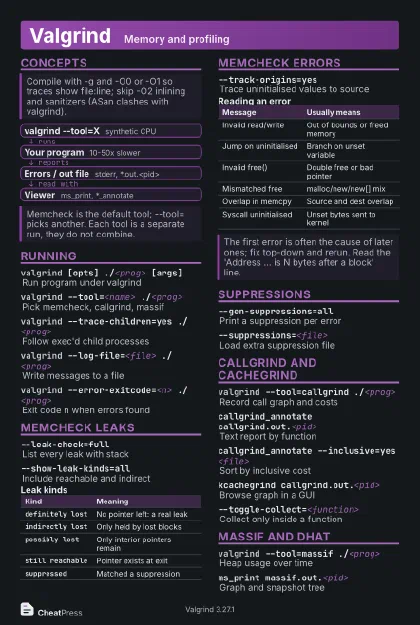 Dark · Postcard
102 × 152 mm · PDF
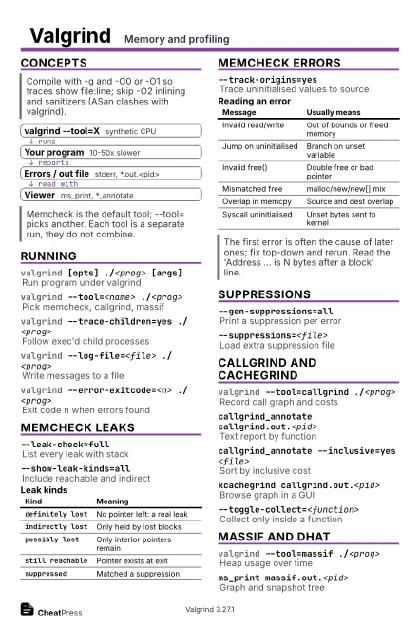 Ink saver · Postcard
102 × 152 mm · PDF
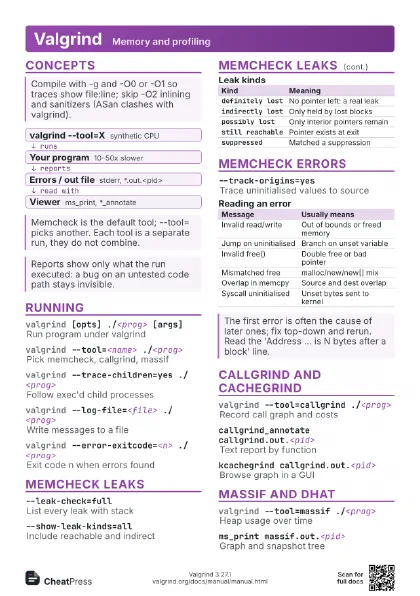
 Light · A4 landscape
297 × 210 mm · PDF
 Dark · A4 landscape
297 × 210 mm · PDF
 Ink saver · A4 landscape
297 × 210 mm · PDF
 Light · A3 landscape
420 × 297 mm · PDF
 Dark · A3 landscape
420 × 297 mm · PDF
 Ink saver · A3 landscape
420 × 297 mm · PDF


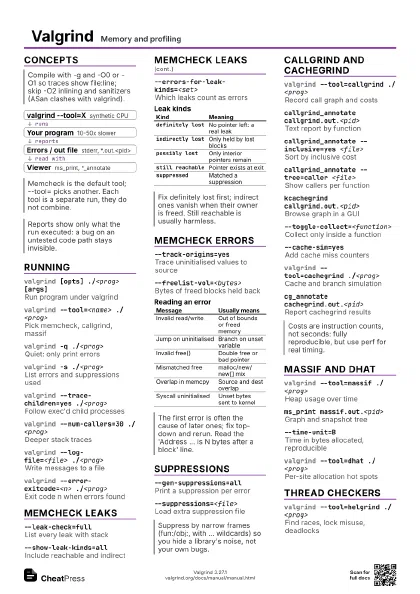
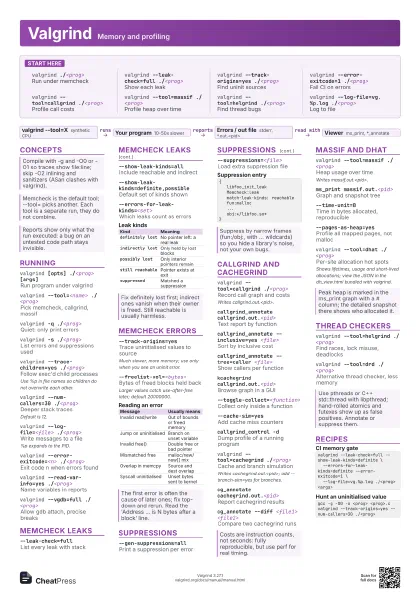
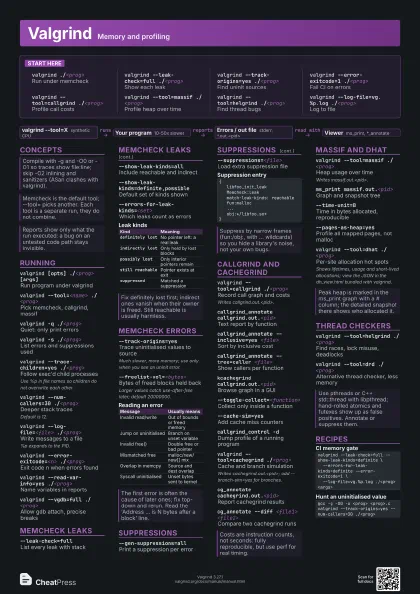
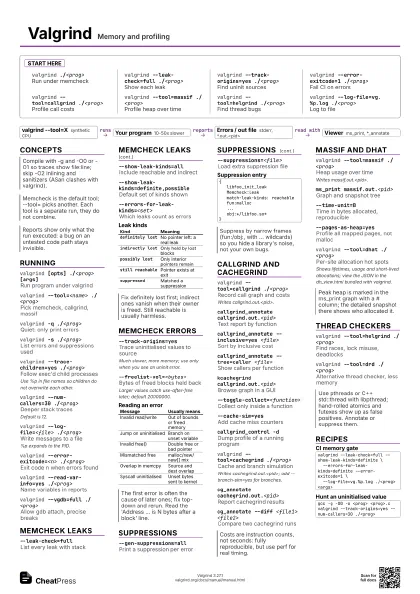
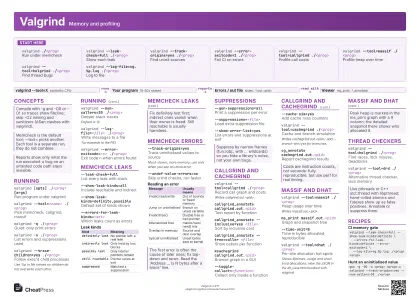
Start here
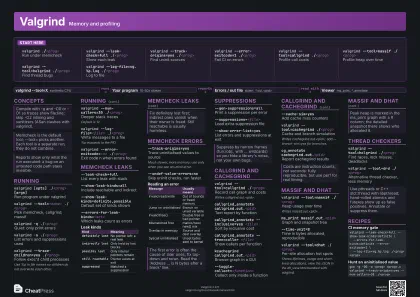
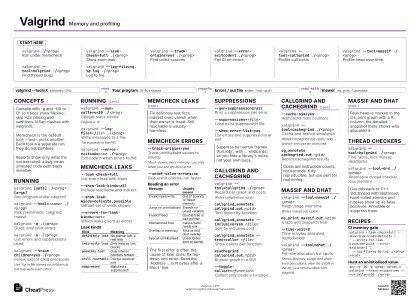
valgrind ./<prog>
Run under memcheck
valgrind --leak-check=full ./<prog>
Show each leak
valgrind --track-origins=yes ./<prog>
Find uninit sources
valgrind --error-exitcode=1 ./<prog>
Fail CI on errors
valgrind --tool=callgrind ./<prog>
Profile call costs
valgrind --tool=massif ./<prog>
Profile heap over time
valgrind --tool=helgrind ./<prog>
Find thread bugs
valgrind --log-file=vg.%p.log ./<prog>
Log to file
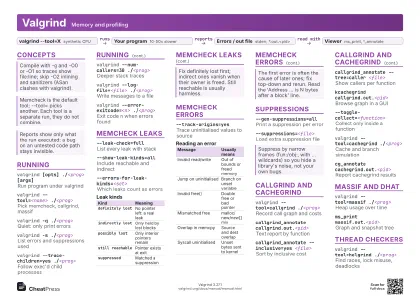
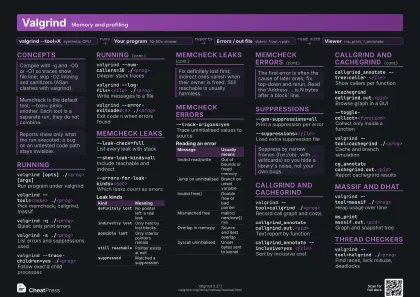
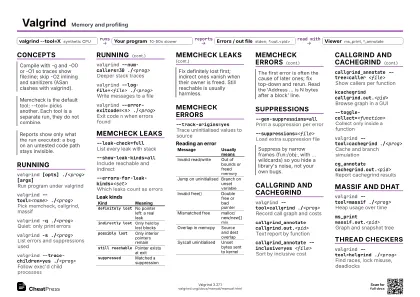
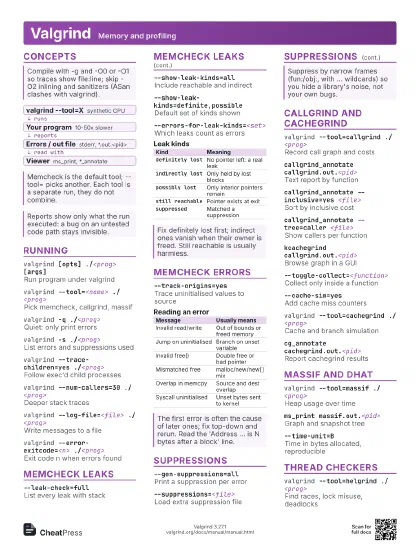
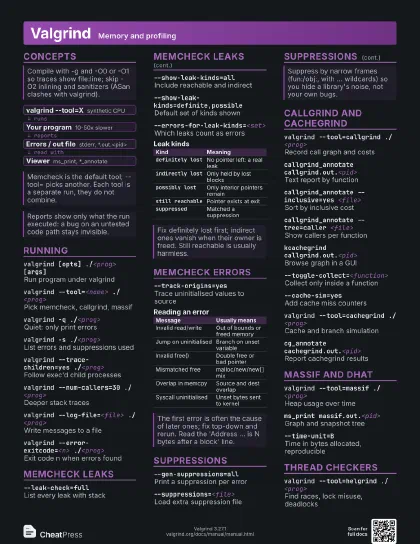
Concepts
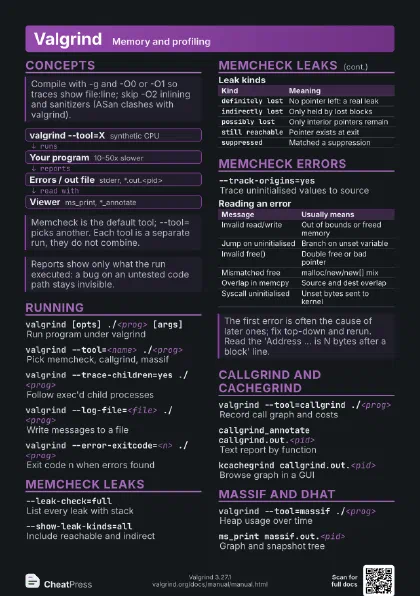
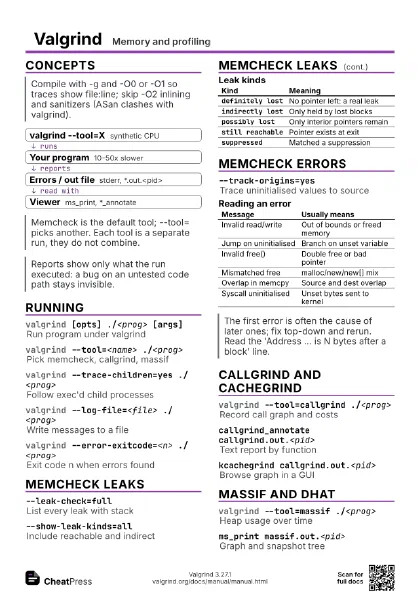
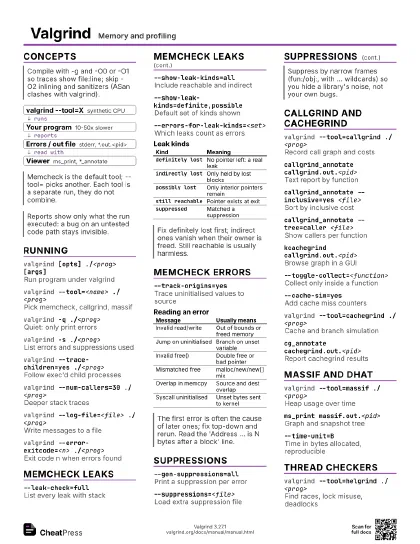
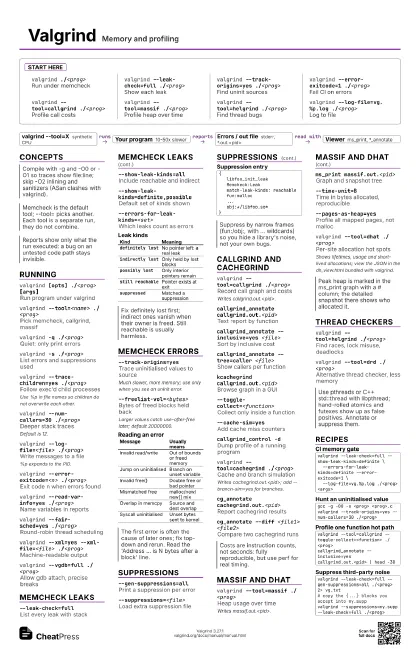
- valgrind --tool=X synthetic CPU
- Your program 10-50x slower
- Errors / out file stderr, *.out.<pid>
- Viewer ms_print, *_annotate
Running
valgrind [opts] ./<prog> [args]
Run program under valgrind
valgrind --tool=<name> ./<prog>
Pick memcheck, callgrind, massif
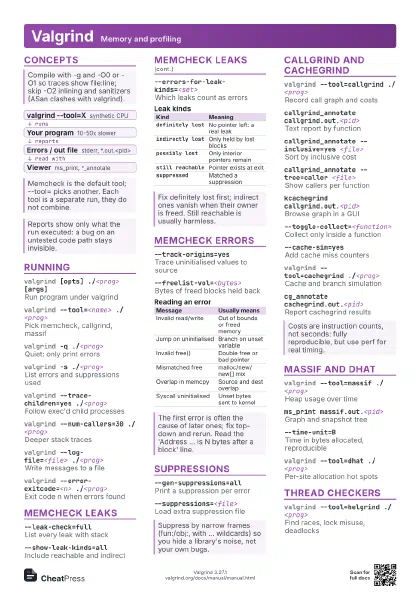
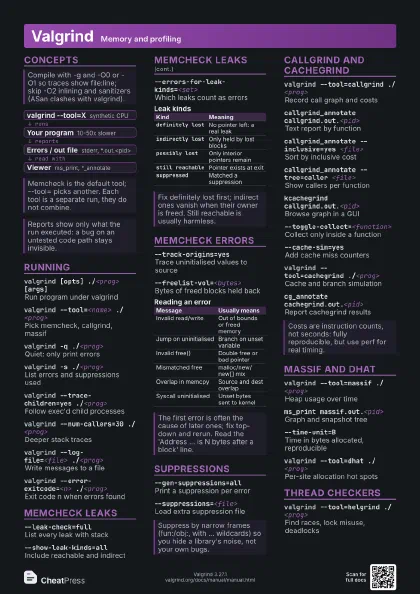
valgrind -q ./<prog>
Quiet: only print errors
valgrind -s ./<prog>
List errors and suppressions used
valgrind --trace-children=yes ./<prog>
Follow exec'd child processes
Use %p in file names so children do not overwrite each other.
valgrind --num-callers=30 ./<prog>
Deeper stack traces
Default is 12.
valgrind --log-file=<file> ./<prog>
Write messages to a file
%p expands to the PID.
valgrind --error-exitcode=<n> ./<prog>
Exit code n when errors found
valgrind --read-var-info=yes ./<prog>
Name variables in reports
valgrind --fair-sched=yes ./<prog>
Round-robin thread scheduling
valgrind --xml=yes --xml-file=<file>
                    ./<prog>
Machine-readable output
valgrind --vgdb=full ./<prog>
Allow gdb attach, precise breaks
valgrind --tool=none ./<prog>
Run with no instrumentation
Memcheck leaks
--leak-check=full
List every leak with stack
--show-leak-kinds=all
Include reachable and indirect
--show-leak-kinds=definite,possible
Default set of kinds shown
--errors-for-leak-kinds=<set>
Which leaks count as errors
--leak-resolution=low
Merge similar leak traces
--leak-check-heuristics=<set>
Treat interior pointers as reachable
--keep-stacktraces=alloc-and-free
Which stacks to record per block
--xtree-leak=yes
Write leaks as callgrind-format file
| Kind | Meaning |
|---|---|
definitely lost |
No pointer left: a real leak |
indirectly lost |
Only held by lost blocks |
possibly lost |
Only interior pointers remain |
still reachable |
Pointer exists at exit |
suppressed |
Matched a suppression |
Memcheck errors
--track-origins=yes
Trace uninitialised values to source
Much slower, more memory; use only when you see an uninit
error.
--undef-value-errors=no
Skip uninit checks, run faster
--malloc-fill=<hex>
Fill new allocations with a byte
--free-fill=<hex>
Fill freed blocks with a byte
--freelist-vol=<bytes>
Bytes of freed blocks held back
Larger values catch use-after-free later; default 20000000.
--show-mismatched-frees=no
Skip malloc/delete mismatch reports
--partial-loads-ok=no
Flag loads straddling block end
--ignore-ranges=0x<A>-0x<B>
Skip checks for an address range
| Message | Usually means |
|---|---|
| Invalid read/write | Out of bounds or freed memory |
| Jump on uninitialised | Branch on unset variable |
| Invalid free() | Double free or bad pointer |
| Mismatched free | malloc/new/new[] mix |
| Overlap in memcpy | Source and dest overlap |
| Syscall uninitialised | Unset bytes sent to kernel |
Suppressions
--gen-suppressions=all
Print a suppression per error
--gen-suppressions=yes
Ask for each error interactively
--suppressions=<file>
Load extra suppression file
--show-error-list=yes
List errors and suppressions at exit
{ libfoo_init_leak Memcheck:Leak match-leak-kinds: reachable fun:malloc ... obj:*/libfoo.so*}Callgrind and cachegrind
valgrind --tool=callgrind ./<prog>
Record call graph and costs
Writes callgrind.out.<pid>.
callgrind_annotate callgrind.out.<pid>
Text report by function
callgrind_annotate --inclusive=yes <file>
Sort by inclusive cost
callgrind_annotate --tree=caller <file>
Show callers per function
kcachegrind callgrind.out.<pid>
Browse graph in a GUI
--toggle-collect=<function>
Collect only inside a function
--cache-sim=yesAdd cache miss counters
--branch-sim=yes
Add branch misprediction counters
--dump-instr=yes
Per-instruction costs (KCachegrind)
--callgrind-out-file=<file>
Name the output file
callgrind_control -d
Dump profile of a running program
callgrind_control -z
Zero counters of running program
valgrind --tool=cachegrind ./<prog>
Cache and branch simulation
Writes cachegrind.out.<pid>; add --branch-sim=yes for
branches.
cg_annotate cachegrind.out.<pid>
Report cachegrind results
cg_annotate --diff <file1> <file2>
Compare two cachegrind runs
--I1=<size>,<assoc>,<line> (also --D1,
                    --LL)
Set simulated cache geometry
Massif and DHAT
valgrind --tool=massif ./<prog>
Heap usage over time
Writes massif.out.<pid>.
ms_print massif.out.<pid>
Graph and snapshot tree
--time-unit=BTime in bytes allocated, reproducible
--stacks=yesAlso profile stack (slow)
--pages-as-heap=yes
Profile all mapped pages, not malloc
--detailed-freq=<n>
Every nth snapshot is detailed
--threshold=<pct>
Hide entries below this share
--massif-out-file=<file>
Name the output file
valgrind --tool=dhat ./<prog>
Per-site allocation hot spots
Shows lifetimes, usage and short-lived allocations; view the
JSON in the dh_view.html bundled with valgrind.
Thread checkers
valgrind --tool=helgrind ./<prog>
Find races, lock misuse, deadlocks
valgrind --tool=drd ./<prog>
Alternative thread checker, less memory
--track-lockorders=no
Disable lock-order checking
--history-level=approx
Faster, rougher race history
--conflict-cache-size=<n>
Bigger history; fixes single-stack races
--check-stack-refs=no
Skip stack races for speed
--free-is-write=yes
Treat free as write to find races
Recipes
valgrind --leak-check=full --show-leak-kinds=definite \ --errors-for-leak-kinds=definite --error-exitcode=1 \ --log-file=vg.%p.log ./<prog> <args>gcc -g -O0 -o <prog> <prog>.cvalgrind --track-origins=yes --num-callers=30 ./<prog>valgrind --tool=callgrind --toggle-collect=<function> ./<prog>callgrind_annotate --inclusive=yes callgrind.out.<pid> | head -30valgrind --leak-check=full --gen-suppressions=all ./<prog> 2> vg.txt# copy the {...} blocks you accept into my.suppvalgrind --suppressions=my.supp --leak-check=full ./<prog>