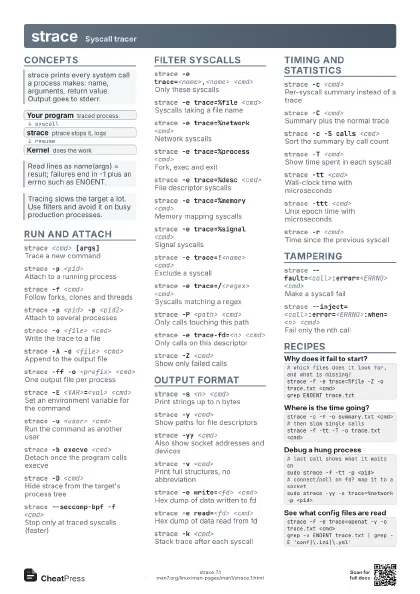
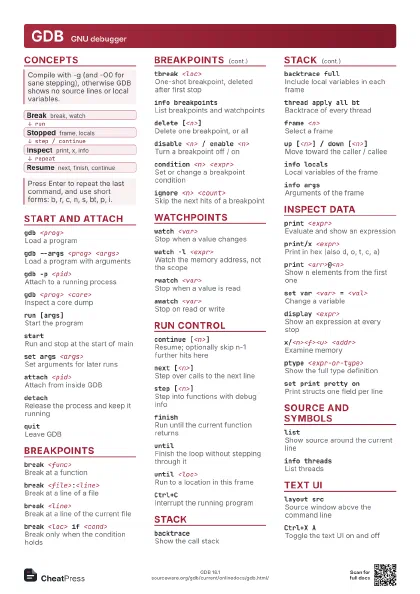
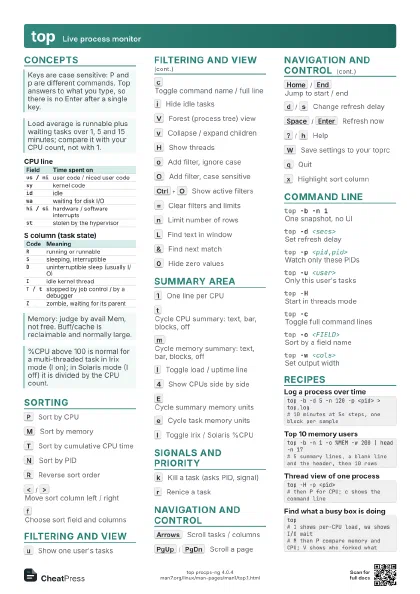
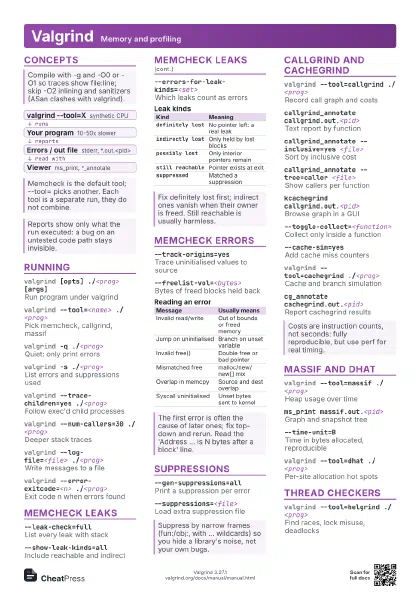
Cheat
perf Linux profiler
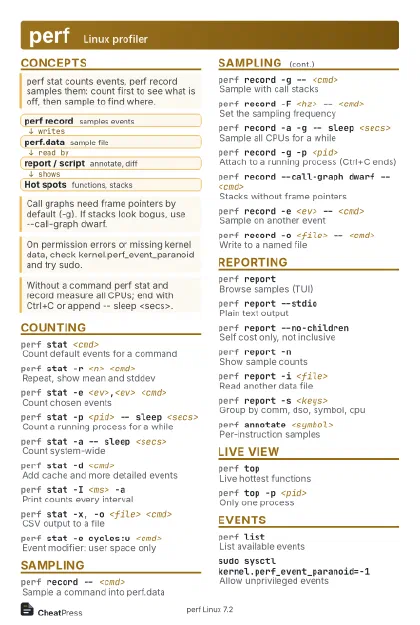 Light · Postcard
102 × 152 mm · PDF
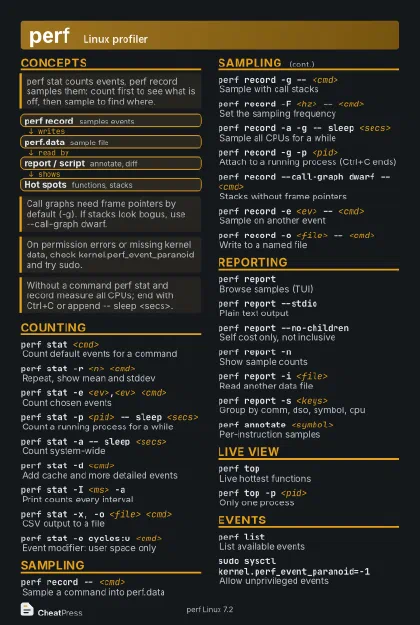 Dark · Postcard
102 × 152 mm · PDF
 Ink saver · Postcard
102 × 152 mm · PDF
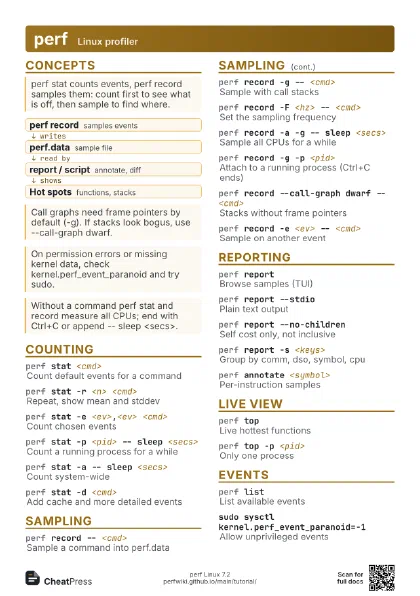
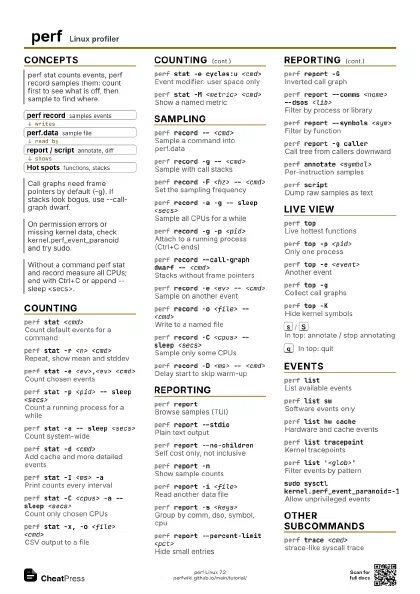
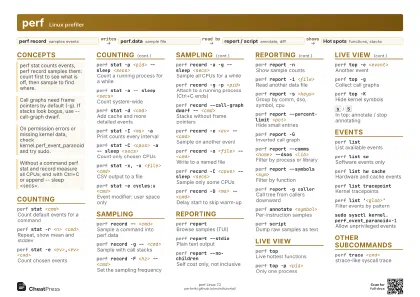 Light · A4 landscape
297 × 210 mm · PDF
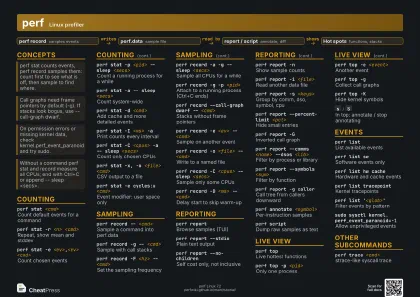 Dark · A4 landscape
297 × 210 mm · PDF
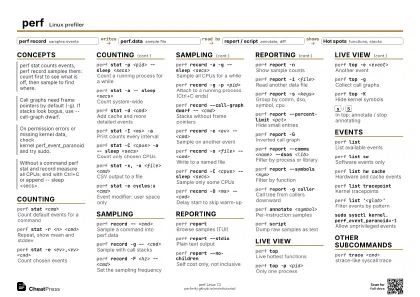 Ink saver · A4 landscape
297 × 210 mm · PDF
 Light · A3 landscape
420 × 297 mm · PDF
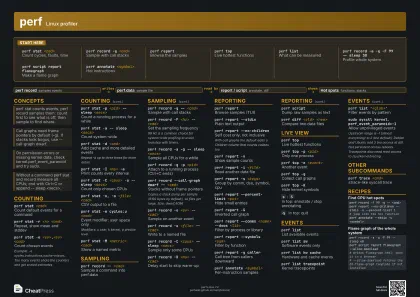 Dark · A3 landscape
420 × 297 mm · PDF
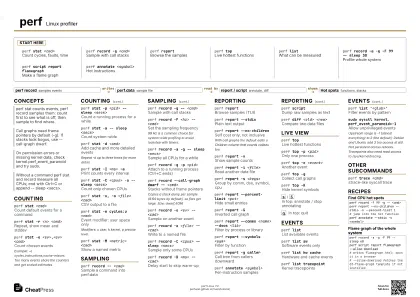 Ink saver · A3 landscape
420 × 297 mm · PDF
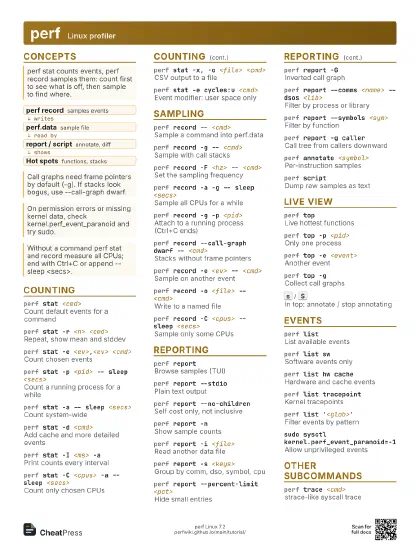
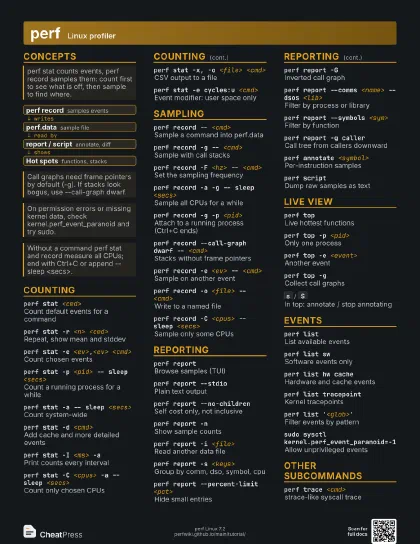
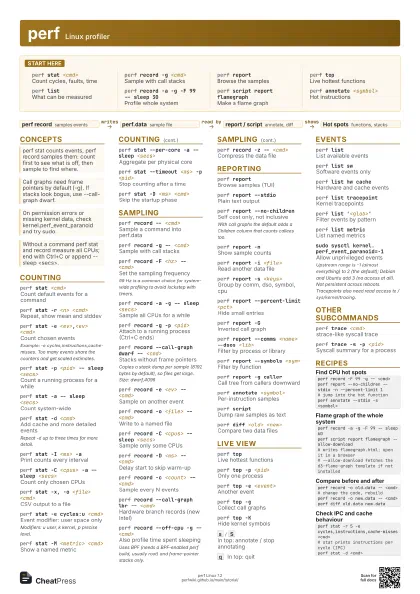
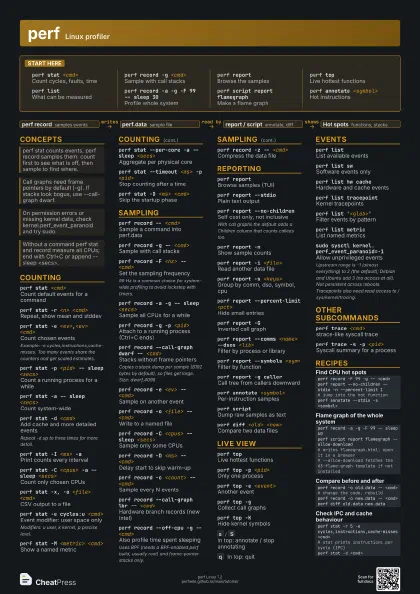
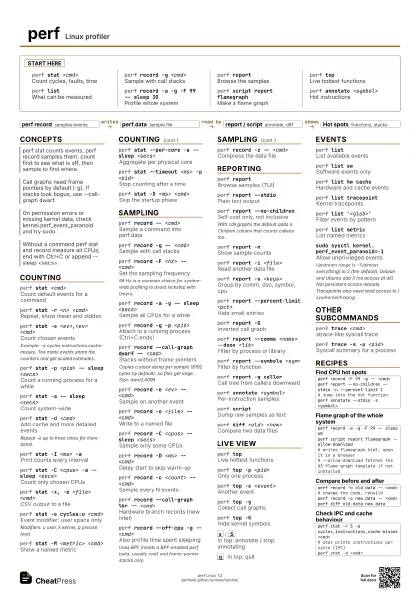
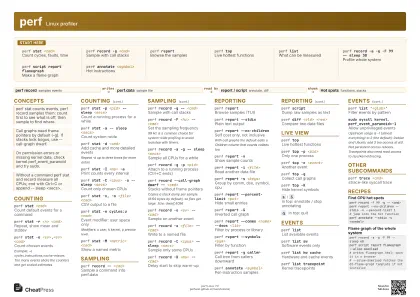
Start here
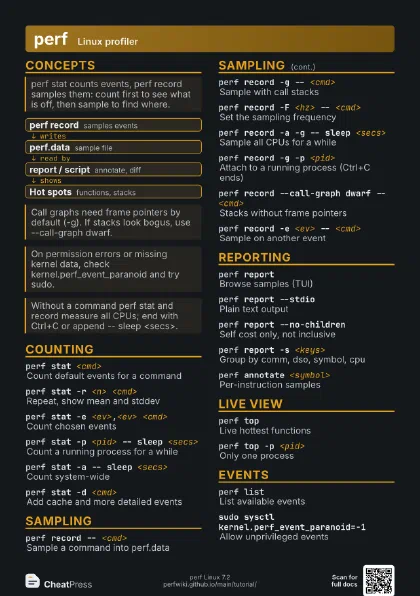
perf stat <cmd>
Count cycles, faults, time
perf record -g <cmd>
Sample with call stacks
perf reportBrowse the samples
perf topLive hottest functions
perf listWhat can be measured
perf record -a -g -F 99 -- sleep 30
Profile whole system
perf script report flamegraph
Make a flame graph
perf annotate <symbol>
Hot instructions
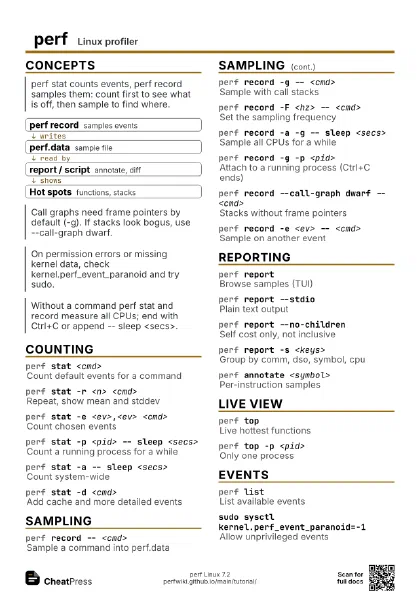
Concepts
- perf record samples events
- perf.data sample file
- report / script annotate, diff
- Hot spots functions, stacks
Counting
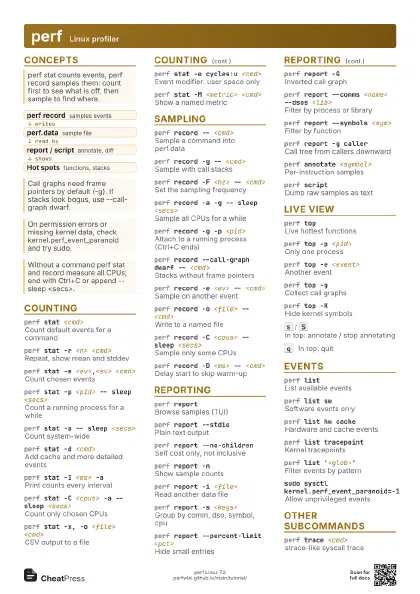
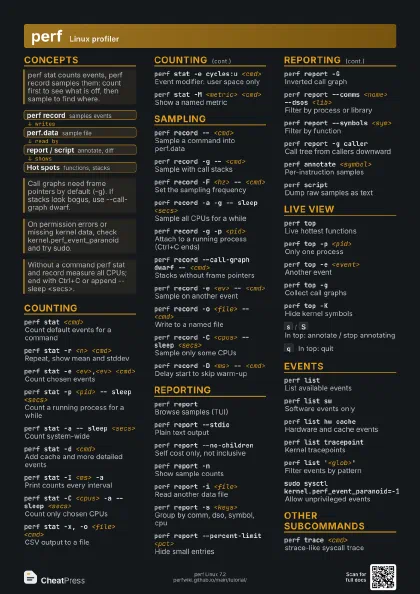
perf stat <cmd>
Count default events for a command
perf stat -r <n> <cmd>
Repeat, show mean and stddev
perf stat -e <ev>,<ev> <cmd>
Count chosen events
Example: -e cycles,instructions,cache-misses. Too many events
share the counters and get scaled estimates.
perf stat -p <pid> -- sleep <secs>
Count a running process for a while
perf stat -a -- sleep <secs>
Count system-wide
perf stat -d <cmd>
Add cache and more detailed events
Repeat -d up to three times for more detail.
perf stat -I <ms> -a
Print counts every interval
perf stat -C <cpus> -a -- sleep <secs>
Count only chosen CPUs
perf stat -x, -o <file> <cmd>
CSV output to a file
perf stat -e cycles:u <cmd>
Event modifier: user space only
Modifiers: u user, k kernel, p precise level.
perf stat -M <metric> <cmd>
Show a named metric
perf stat --per-core -a -- sleep <secs>
Aggregate per physical core
perf stat --timeout <ms> -p <pid>
Stop counting after a time
perf stat -D <ms> <cmd>
Skip the startup phase
Sampling
perf record -- <cmd>
Sample a command into perf.data
perf record -g -- <cmd>
Sample with call stacks
perf record -F <hz> -- <cmd>
Set the sampling frequency
99 Hz is a common choice for system-wide profiling to avoid
lockstep with timers.
perf record -a -g -- sleep <secs>
Sample all CPUs for a while
perf record -g -p <pid>
Attach to a running process (Ctrl+C ends)
perf record --call-graph dwarf -- <cmd>
Stacks without frame pointers
Copies a stack dump per sample (8192 bytes by default), so
files get large. Size: dwarf,4096
perf record -e <ev> -- <cmd>
Sample on another event
perf record -o <file> -- <cmd>
Write to a named file
perf record -C <cpus> -- sleep <secs>
Sample only some CPUs
perf record -D <ms> -- <cmd>
Delay start to skip warm-up
perf record -c <count> -- <cmd>
Sample every N events
perf record --call-graph lbr -- <cmd>
Hardware branch records (new Intel)
perf record --off-cpu -g -- <cmd>
Also profile time spent sleeping
Uses BPF (needs a BPF-enabled perf build, usually root) and
frame-pointer stacks only.
perf record --switch-output=<size|time> -a
Rotate perf.data files
perf record -z -- <cmd>
Compress the data file
perf record -d -- <cmd>
Record data addresses
Reporting
perf reportBrowse samples (TUI)
perf report --stdio
Plain text output
perf report --no-children
Self cost only, not inclusive
With call graphs the default adds a Children column that
counts callees too.
perf report -nShow sample counts
perf report -i <file>
Read another data file
perf report -s <keys>
Group by comm, dso, symbol, cpu
perf report --percent-limit <pct>
Hide small entries
perf report -GInverted call graph
perf report --comms <name> --dsos <lib>
Filter by process or library
perf report --symbols <sym>
Filter by function
perf report -g caller
Call tree from callers downward
perf report --hierarchy
Nested view per sort key
perf report -k <vmlinux>
Resolve kernel symbols
perf report --header
Show system and event info
perf annotate <symbol>
Per-instruction samples
perf annotate --stdio -s <symbol>
Annotate as plain text
perf scriptDump raw samples as text
perf script -F <fields>
Choose output fields
perf diff <old> <new>
Compare two data files
Live view
perf topLive hottest functions
perf top -p <pid>
Only one process
perf top -e <event>
Another event
perf top -gCollect call graphs
perf top -KHide kernel symbols
perf top -d <secs> -E <n>
Refresh delay and rows shown
s
/
S
In top: annotate / stop annotating
K
/
U
In top: hide kernel / user symbols
z
In top: toggle zeroing counts
q
In top: quit
Events
perf listList available events
perf list swSoftware events only
perf list hw cache
Hardware and cache events
perf list tracepoint
Kernel tracepoints
perf list '<glob>'
Filter events by pattern
perf list metric
List named metrics
-e sched:sched_switch
Tracepoint form group:event
-e <pmu>/<param>=<val>/
Raw PMU event with parameters
sudo sysctl kernel.perf_event_paranoid=-1
Allow unprivileged events
Upstream range is -1 (almost everything) to 2 (the default);
Debian and Ubuntu add 3 (no access at all). Not persistent
across reboots. Tracepoints also need read access to
/sys/kernel/tracing.
ulimit -n <n>
Fix 'too many open files'
Other subcommands
perf trace <cmd>
strace-like syscall trace
perf trace -s -p <pid>
Syscall summary for a process
perf trace --failure -p <pid>
Only failing syscalls
perf sched record -- <cmd>
Record scheduler events
perf sched latency
Per-task scheduling delays
perf bench sched pipe
Scheduler micro-benchmark
perf c2c record -- <cmd>
Find cache-line contention
perf mem record -- <cmd>
Sample memory accesses
perf lock contention
Lock contention from perf lock record
Recipes
perf record -F 99 -g -- <cmd>perf report --no-children --stdio -n --percent-limit 1# jump into the hot functionperf annotate --stdio -s <symbol>perf record -a -g -F 99 -- sleep 60perf script report flamegraph --allow-download# writes flamegraph.html; open it in a browser# --allow-download fetches the d3-flame-graph template if not installedperf record -o old.data -- <cmd># change the code, rebuildperf record -o new.data -- <cmd>perf diff old.data new.dataperf stat -r 5 -e cycles,instructions,cache-misses <cmd># stat prints instructions per cycle (IPC)perf stat -d <cmd>