Cheat
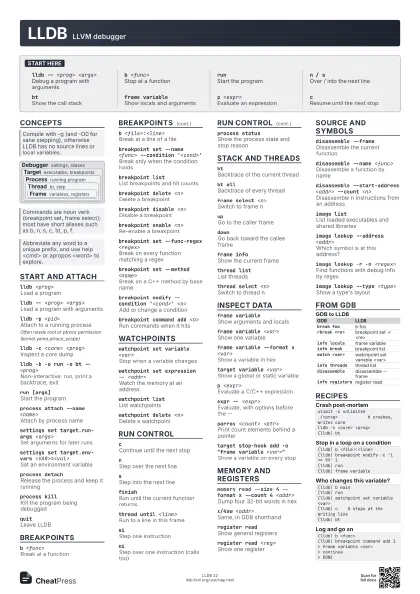
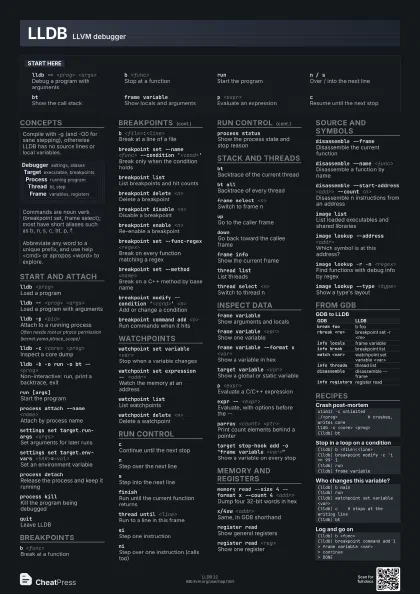
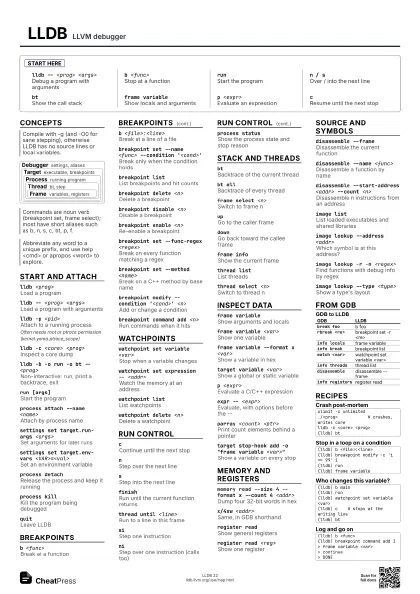
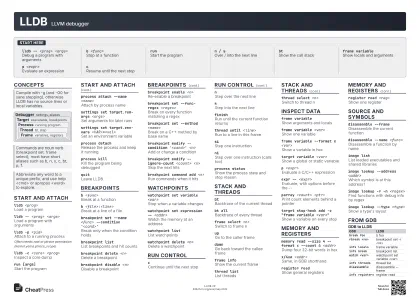
LLDB LLVM debugger
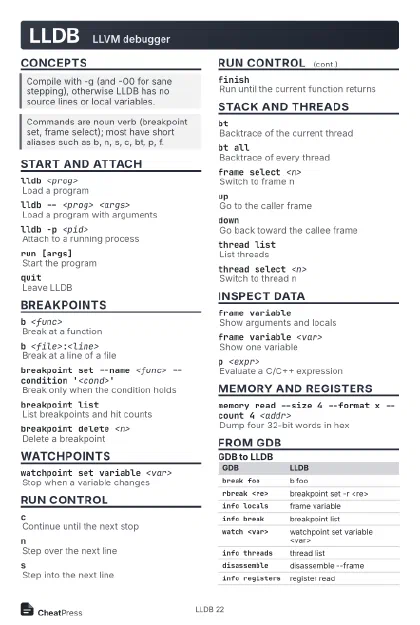 Light · Postcard
102 × 152 mm · PDF
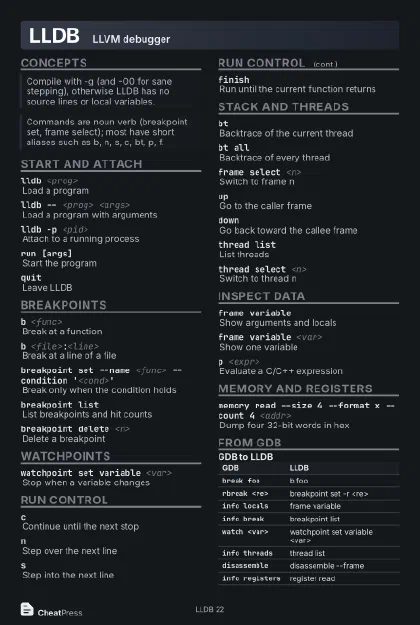 Dark · Postcard
102 × 152 mm · PDF
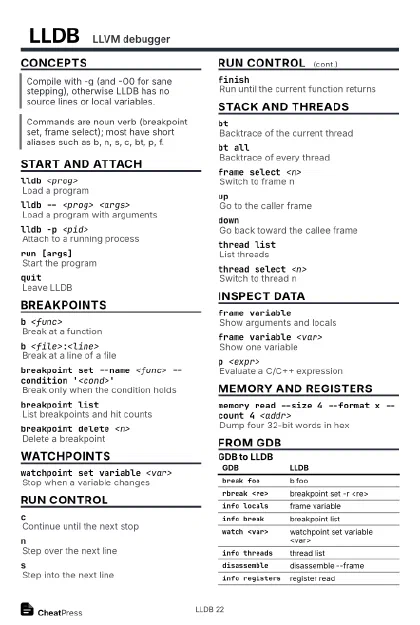 Ink saver · Postcard
102 × 152 mm · PDF
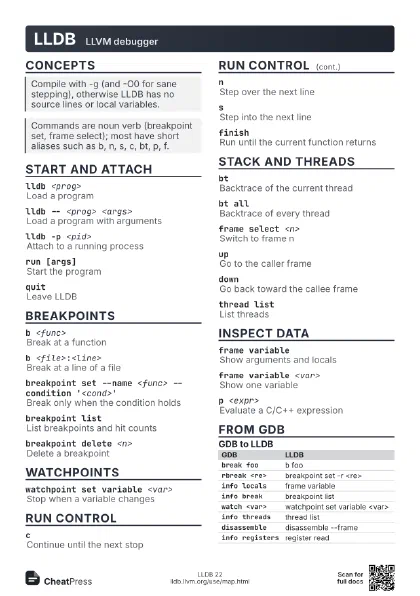
 Light · A4 landscape
297 × 210 mm · PDF
 Dark · A4 landscape
297 × 210 mm · PDF
 Ink saver · A4 landscape
297 × 210 mm · PDF
 Light · A3 landscape
420 × 297 mm · PDF
 Dark · A3 landscape
420 × 297 mm · PDF
 Ink saver · A3 landscape
420 × 297 mm · PDF
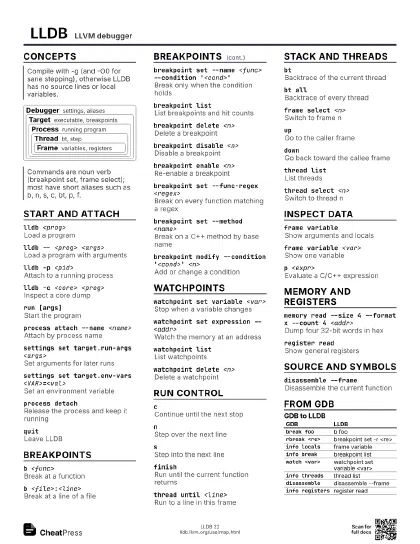
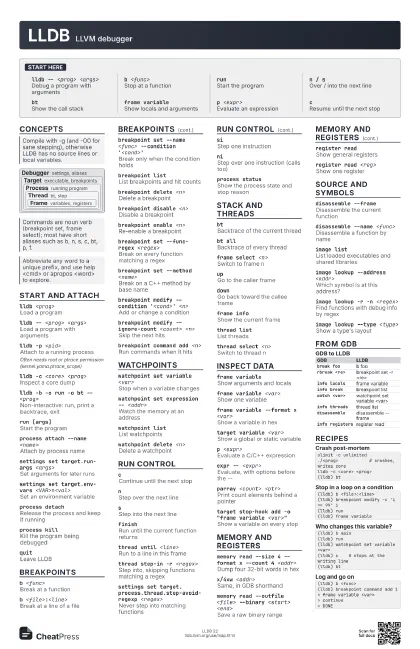
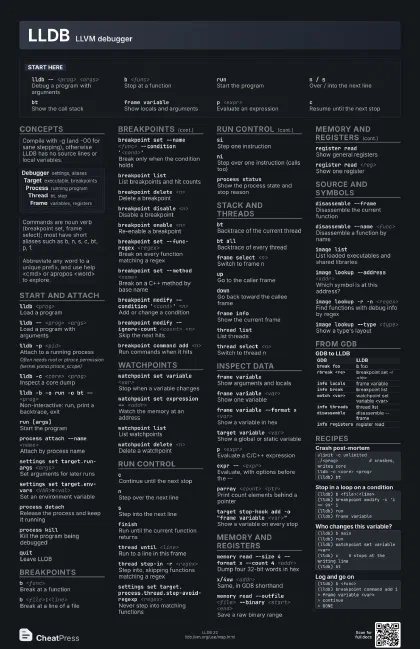
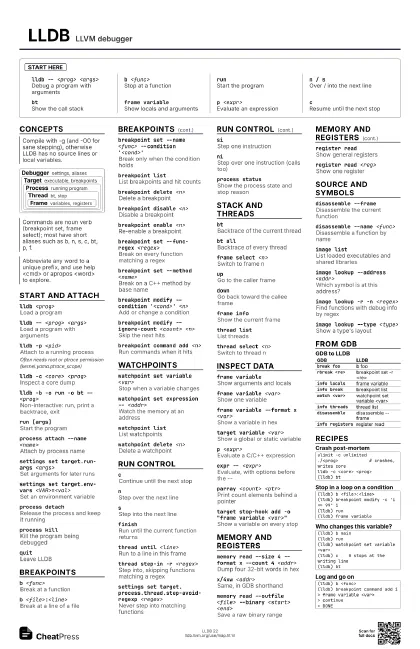
Start here
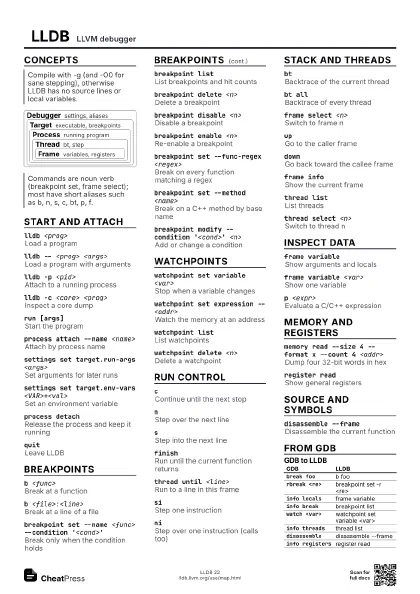
lldb -- <prog> <args>
Debug a program with arguments
b <func>Stop at a function
runStart the program
n / sOver / into the next line
btShow the call stack
frame variableShow locals and arguments
p <expr>Evaluate an expression
cResume until the next stop
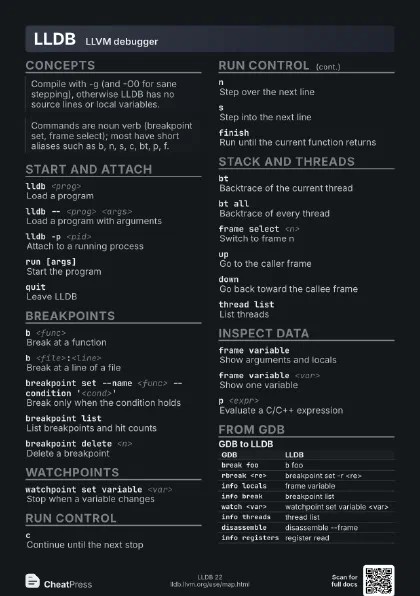
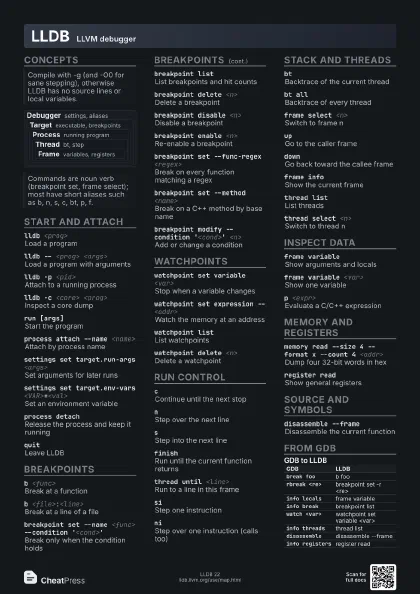
Concepts
Debugger settings, aliases
Target
executable, breakpoints
Process running program
Thread bt, step
Frame
variables, registers
Start and attach
lldb <prog>
Load a program
lldb -- <prog> <args>
Load a program with arguments
lldb -p <pid>
Attach to a running process
Often needs root or ptrace permission
(kernel.yama.ptrace_scope)
lldb -c <core> <prog>
Inspect a core dump
lldb -b -o run -o bt -- <prog>
Non-interactive: run, print a backtrace, exit
run [args]Start the program
process attach --name <name>
Attach by process name
settings set target.run-args <args>
Set arguments for later runs
settings set target.env-vars <VAR>=<val>
Set an environment variable
process detachRelease the process and keep it running
process killKill the program being debugged
quitLeave LLDB
Breakpoints
b <func>Break at a function
b <file>:<line>
Break at a line of a file
breakpoint set --name <func> --condition
                    '<cond>'
Break only when the condition holds
breakpoint listList breakpoints and hit counts
breakpoint delete <n>
Delete a breakpoint
breakpoint disable <n>
Disable a breakpoint
breakpoint enable <n>
Re-enable a breakpoint
breakpoint set --func-regex <regex>
Break on every function matching a regex
breakpoint set --method <name>
Break on a C++ method by base name
breakpoint modify --condition '<cond>'
                    <n>
Add or change a condition
breakpoint modify --ignore-count <count>
                    <n>
Skip the next hits
breakpoint command add <n>
Run commands when it hits
Watchpoints
watchpoint set variable <var>
Stop when a variable changes
watchpoint set expression -- <addr>
Watch the memory at an address
watchpoint listList watchpoints
watchpoint delete <n>
Delete a watchpoint
Run control
cContinue until the next stop
nStep over the next line
sStep into the next line
finishRun until the current function returns
thread until <line>
Run to a line in this frame
thread step-in -r <regex>
Step into, skipping functions matching a regex
settings set target.process.thread.step-avoid-regexp
                    <regex>
Never step into matching functions
siStep one instruction
niStep over one instruction (calls too)
process statusShow the process state and stop reason
Stack and threads
btBacktrace of the current thread
bt allBacktrace of every thread
frame select <n>
Switch to frame n
upGo to the caller frame
downGo back toward the callee frame
frame infoShow the current frame
thread listList threads
thread select <n>
Switch to thread n
Inspect data
frame variableShow arguments and locals
frame variable <var>
Show one variable
frame variable --format x <var>
Show a variable in hex
target variable <var>
Show a global or static variable
p <expr>Evaluate a C/C++ expression
expr -- <expr>
Evaluate, with options before the --
parray <count> <ptr>
Print count elements behind a pointer
target stop-hook add -o "frame variable
                    <var>"
Show a variable on every stop
Memory and registers
memory read --size 4 --format x --count 4
                    <addr>
Dump four 32-bit words in hex
x/4xw <addr>
Same, in GDB shorthand
memory read --outfile <file> --binary <start>
                    <end>
Save a raw binary range
memory region --all
List the process memory map
register readShow general registers
register read <reg>
Show one register
Source and symbols
disassemble --frame
Disassemble the current function
disassemble --name <func>
Disassemble a function by name
disassemble --start-address <addr> --count
                    <n>
Disassemble n instructions from an address
image list
List loaded executables and shared libraries
image lookup --address <addr>
Which symbol is at this address?
image lookup -r -n <regex>
Find functions with debug info by regex
image lookup --type <type>
Show a type's layout
process save-core <file>
Write a core file of the process
From GDB
| GDB | LLDB |
|---|---|
break foo |
b foo |
rbreak <re> |
breakpoint set -r <re> |
info locals |
frame variable |
info break |
breakpoint list |
watch <var> |
watchpoint set variable <var> |
info threads |
thread list |
disassemble |
disassemble --frame |
info registers |
register read |
Recipes
ulimit -c unlimited./<prog> # crashes, writes corelldb -c <core> <prog>(lldb) bt(lldb) b <file>:<line>(lldb) breakpoint modify -c 'i == 99' 1(lldb) run(lldb) frame variable(lldb) b main(lldb) run(lldb) watchpoint set variable <var>(lldb) c # stops at the writing line(lldb) bt(lldb) b <func>(lldb) breakpoint command add 1> frame variable <var>> continue> DONE