Cheat
GDB GNU debugger
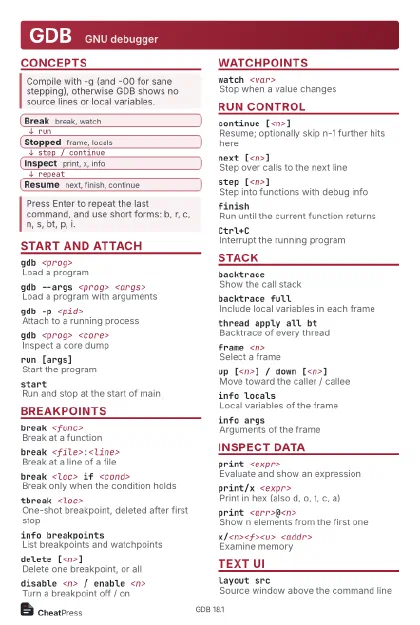 Light · Postcard
102 × 152 mm · PDF
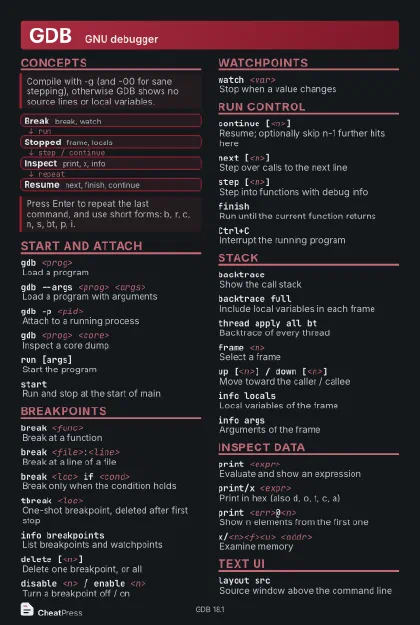 Dark · Postcard
102 × 152 mm · PDF
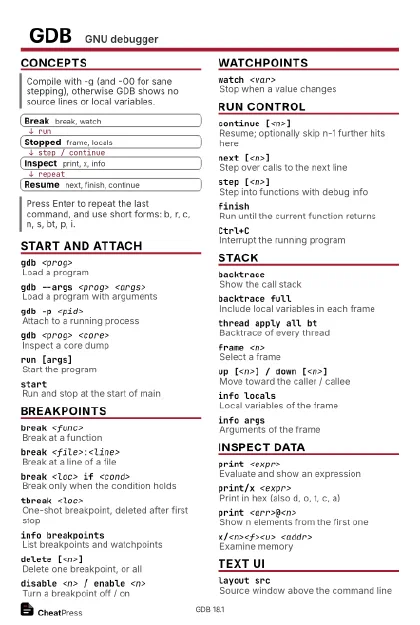 Ink saver · Postcard
102 × 152 mm · PDF
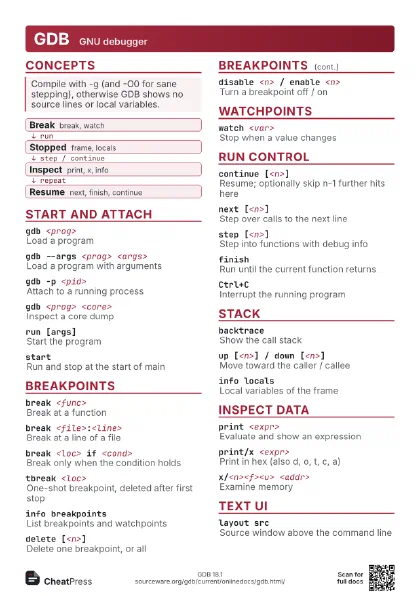
 Light · A4 landscape
297 × 210 mm · PDF
 Dark · A4 landscape
297 × 210 mm · PDF
 Ink saver · A4 landscape
297 × 210 mm · PDF
 Light · A3 landscape
420 × 297 mm · PDF
 Dark · A3 landscape
420 × 297 mm · PDF
 Ink saver · A3 landscape
420 × 297 mm · PDF
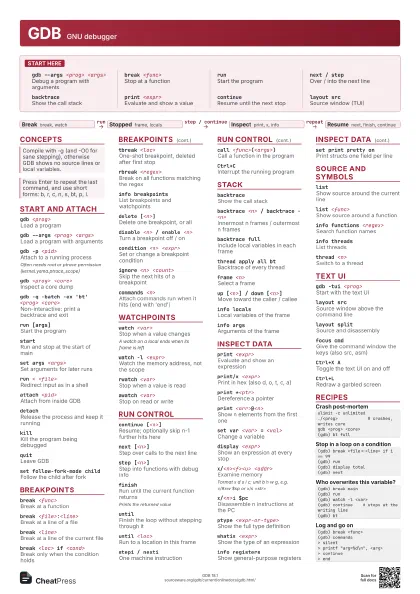
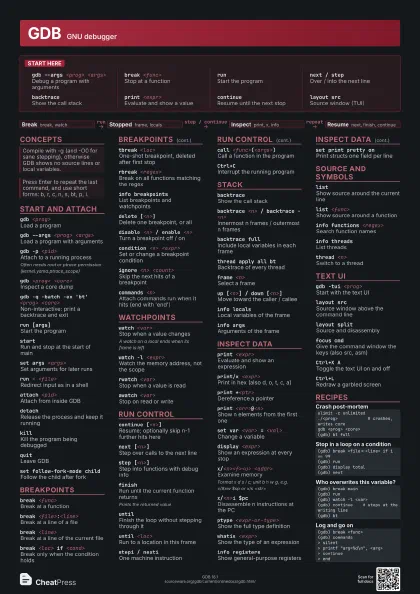
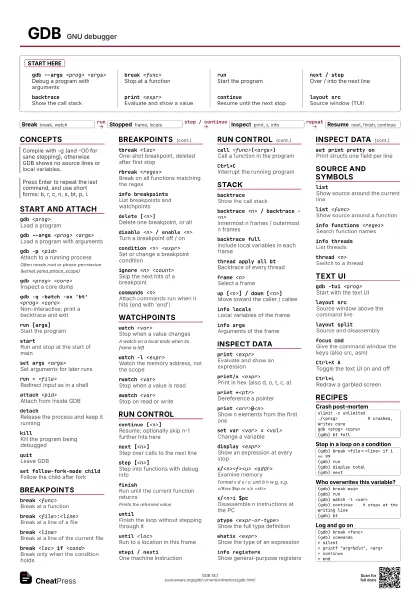
Start here
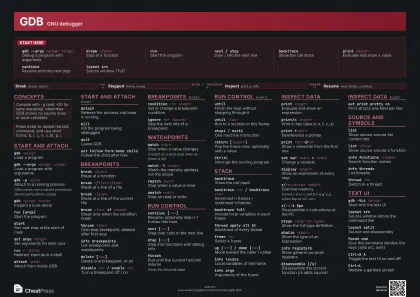
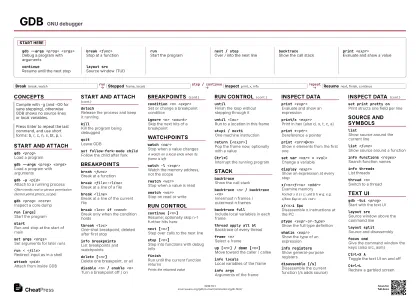
gdb --args <prog> <args>
Debug a program with arguments
break <func>
Stop at a function
runStart the program
next / stepOver / into the next line
backtraceShow the call stack
print <expr>
Evaluate and show a value
continueResume until the next stop
layout srcSource window (TUI)
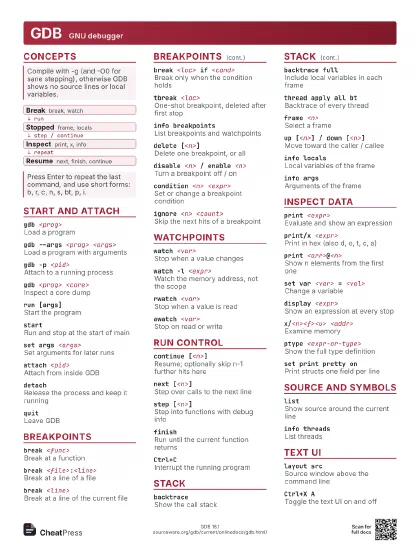
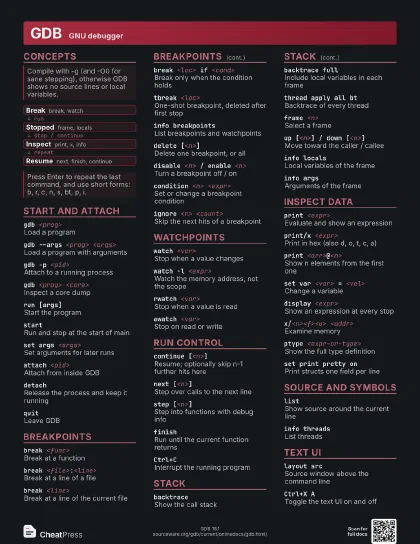
Concepts
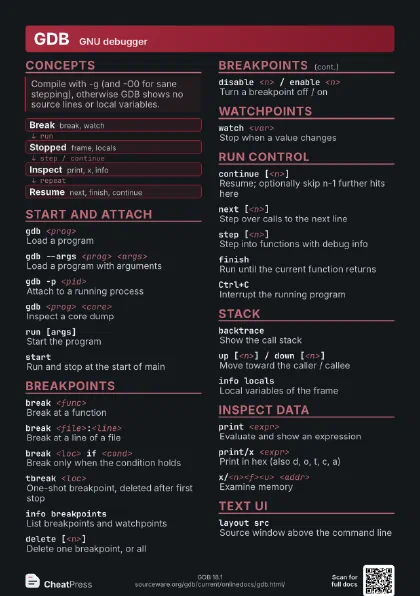
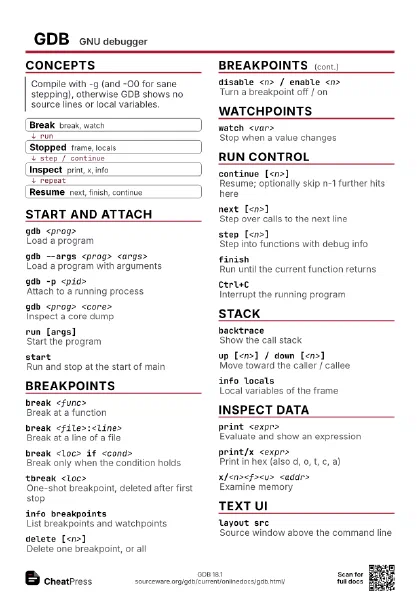
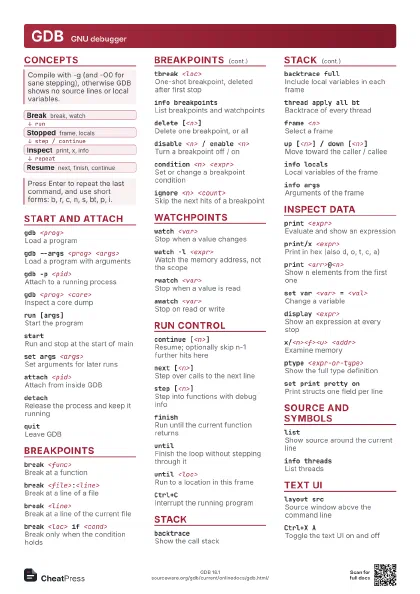
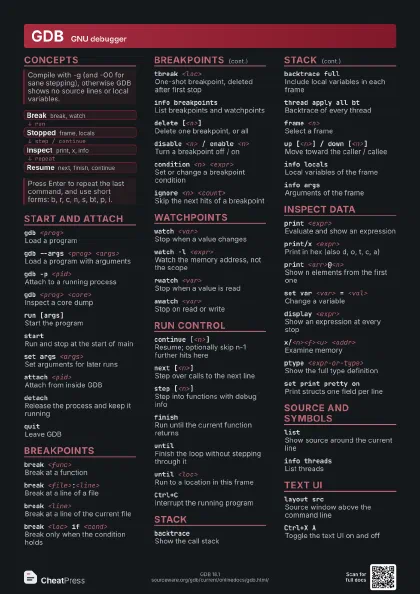
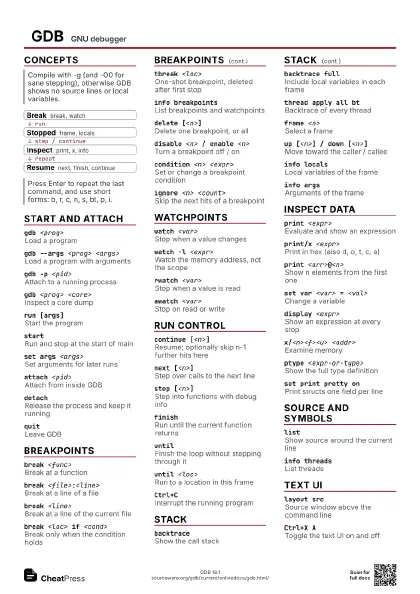
- Break break, watch
- Stopped frame, locals
- Inspect print, x, info
- Resume next, finish, continue
Start and attach
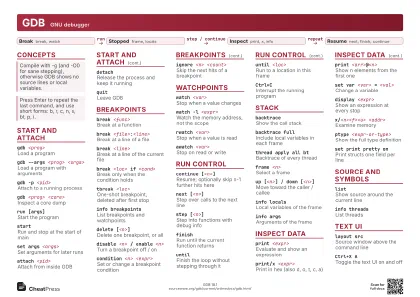
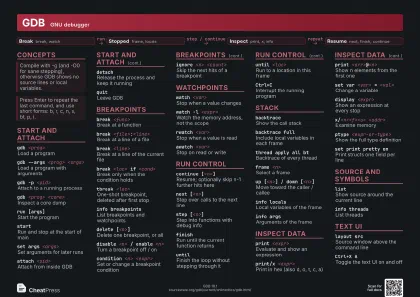
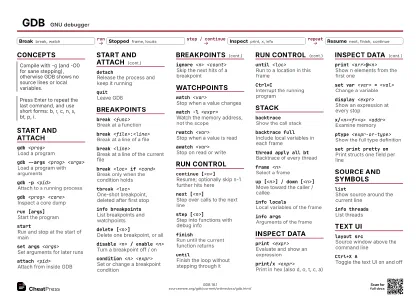
gdb <prog>
Load a program
gdb --args <prog> <args>
Load a program with arguments
gdb -p <pid>
Attach to a running process
Often needs root or ptrace permission
(kernel.yama.ptrace_scope)
gdb <prog> <core>
Inspect a core dump
gdb -q -batch -ex 'bt' <prog>
                    <core>
Non-interactive: print a backtrace and exit
run [args]Start the program
startRun and stop at the start of main
startiRun and stop at the first instruction
set args <args>
Set arguments for later runs
run < <file>
Redirect input as in a shell
attach <pid>
Attach from inside GDB
detachRelease the process and keep it running
killKill the program being debugged
quitLeave GDB
set env <VAR>=<val>
Set an environment variable for the program
set follow-fork-mode child
Follow the child after fork
set detach-on-fork off
Keep debugging both parent and child
file <prog>
Load symbols and executable
shell <cmd>
Run a shell command
Breakpoints
break <func>
Break at a function
break <file>:<line>
Break at a line of a file
break <line>
Break at a line of the current file
break *<addr>
Break at an address
break <loc> if <cond>
Break only when the condition holds
tbreak <loc>
One-shot breakpoint, deleted after first stop
rbreak <regex>
Break on all functions matching the regex
hbreak <loc>
Hardware-assisted breakpoint
info breakpoints
List breakpoints and watchpoints
delete [<n>]
Delete one breakpoint, or all
disable <n> / enable <n>
Turn a breakpoint off / on
condition <n> <expr>
Set or change a breakpoint condition
ignore <n> <count>
Skip the next hits of a breakpoint
commands <n>
Attach commands run when it hits (end with 'end')
clear <loc>
Delete breakpoints at a location
catch syscall <name>
Stop on a system call
catch throw
Stop when a C++ exception is thrown
handle <SIG> nostop noprint pass
Control how a signal is treated
Watchpoints
watch <var>
Stop when a value changes
A watch on a local ends when its frame is left
watch -l <expr>
Watch the memory address, not the scope
rwatch <var>
Stop when a value is read
awatch <var>
Stop on read or write
watch <expr> if <cond>
Conditional watchpoint
info watchpoints
List watchpoints
Run control
continue [<n>]
Resume; optionally skip n-1 further hits here
next [<n>]
Step over calls to the next line
step [<n>]
Step into functions with debug info
finishRun until the current function returns
Prints the returned value
until
Finish the loop without stepping through it
until <loc>
Run to a location in this frame
advance <loc>
Run to a location or until the frame returns
stepi / nextiOne machine instruction
jump <loc>
Resume execution at another location
return [<expr>]
Pop the frame now, optionally with a value
call <func>(<args>)
Call a function in the program
Ctrl+CInterrupt the running program
reverse-stepStep backward (after 'record')
Stack
backtraceShow the call stack
backtrace <n> / backtrace -<n>
Innermost n frames / outermost n frames
backtrace fullInclude local variables in each frame
thread apply all bt
Backtrace of every thread
frame <n>Select a frame
up [<n>] / down [<n>]
Move toward the caller / callee
info frameDetails of the selected frame
info localsLocal variables of the frame
info argsArguments of the frame
Inspect data
print <expr>
Evaluate and show an expression
print/x <expr>
Print in hex (also d, o, t, c, a)
print *<ptr>
Dereference a pointer
print <arr>@<n>
Show n elements from the first one
print $<n> / print $
Reuse an earlier value / the last one
set var <var> = <val>
Change a variable
display <expr>
Show an expression at every stop
undisplay <n>
Remove an auto-display
x/<n><f><u> <addr>
Examine memory
Format x d s i c; unit b h w g, e.g. x/8xw $sp or x/s
<str>
x/<n>i $pc
Disassemble n instructions at the PC
ptype <expr-or-type>
Show the full type definition
whatis <expr>
Show the type of an expression
info registersShow general-purpose registers
print $<reg>
Read one register (e.g. $rip)
disassemble [/s]
Disassemble the current function (/s adds source)
set print pretty on
Print structs one field per line
info line <loc>
Address range of a source line
Source and symbols
listShow source around the current line
list <func>
Show source around a function
info sourceCurrent source file and its details
info functions <regex>
Search function names
info variables <regex>
Search global variable names
info sharedlibrary
Loaded shared libraries
info threadsList threads
thread <n>
Switch to a thread
directory <dir>
Add a directory to the source search path
set logging enabled on
Copy output to gdb.txt
Text UI
gdb -tui <prog>
Start with the text UI
layout srcSource window above the command line
layout splitSource and disassembly
layout regsAdd the register window
focus cmd
Give the command window the keys (also src, asm)
Ctrl+X AToggle the text UI on and off
Ctrl+X OSwitch the active window
Ctrl+LRedraw a garbled screen
Recipes
ulimit -c unlimited./<prog> # crashes, writes coregdb <prog> <core>(gdb) bt full(gdb) break <file>:<line> if i == 99(gdb) run(gdb) display total(gdb) next(gdb) break main(gdb) run(gdb) watch -l <var>(gdb) continue # stops at the writing line(gdb) bt(gdb) break <func>(gdb) commands> silent> printf "arg=%d\n", <arg>> continue> end