Cheat
top Live process monitor
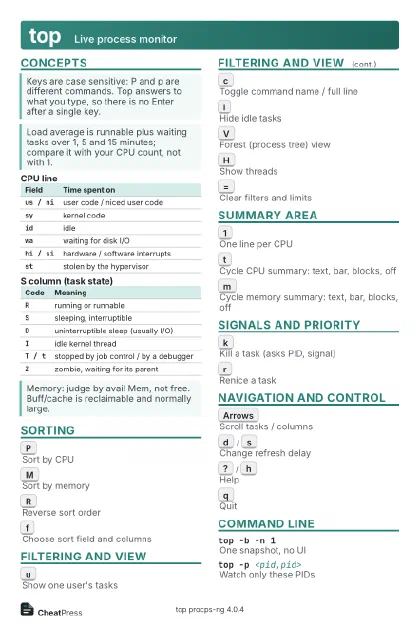 Light · Postcard
102 × 152 mm · PDF
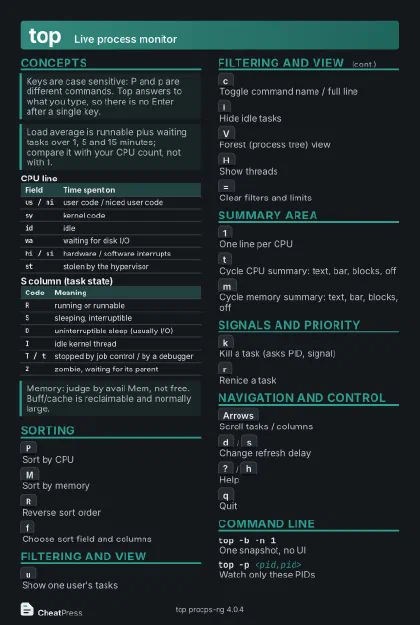 Dark · Postcard
102 × 152 mm · PDF
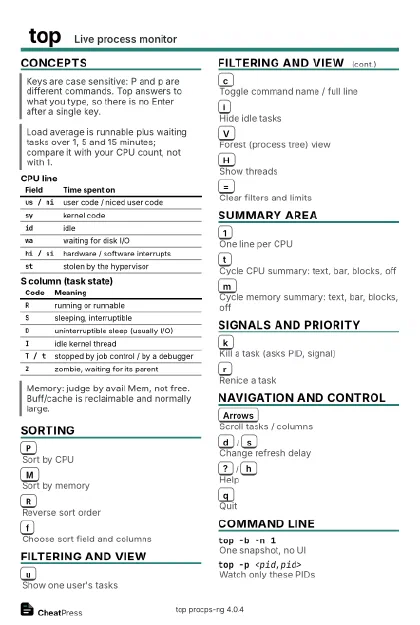 Ink saver · Postcard
102 × 152 mm · PDF
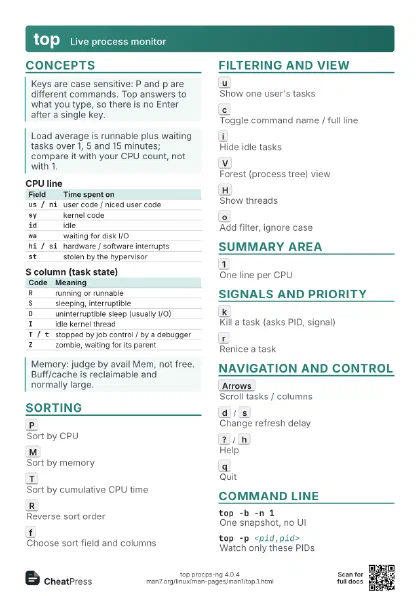
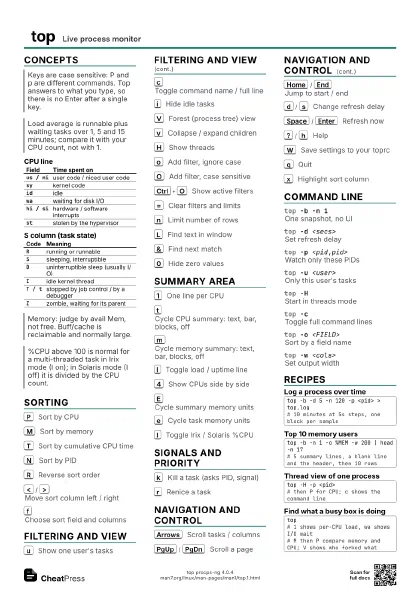
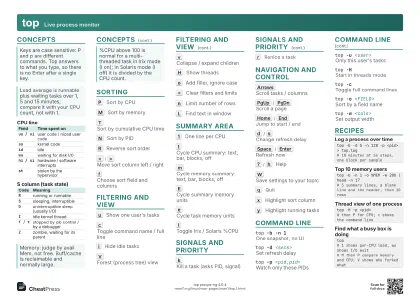 Light · A4 landscape
297 × 210 mm · PDF
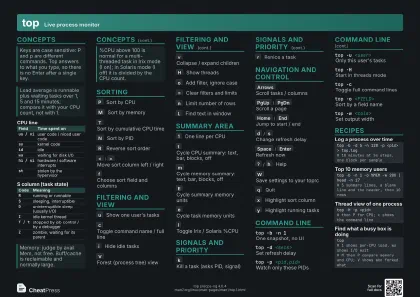 Dark · A4 landscape
297 × 210 mm · PDF
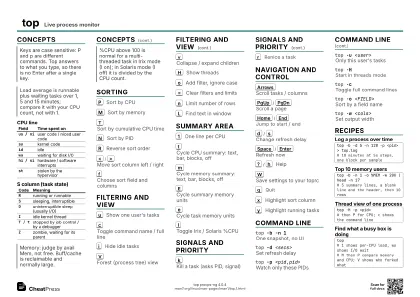 Ink saver · A4 landscape
297 × 210 mm · PDF
 Light · A3 landscape
420 × 297 mm · PDF
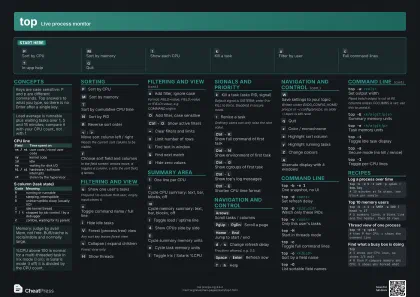 Dark · A3 landscape
420 × 297 mm · PDF
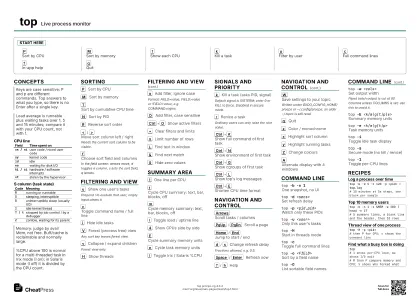 Ink saver · A3 landscape
420 × 297 mm · PDF
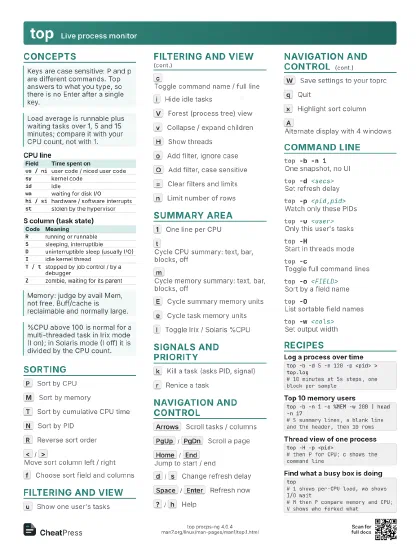
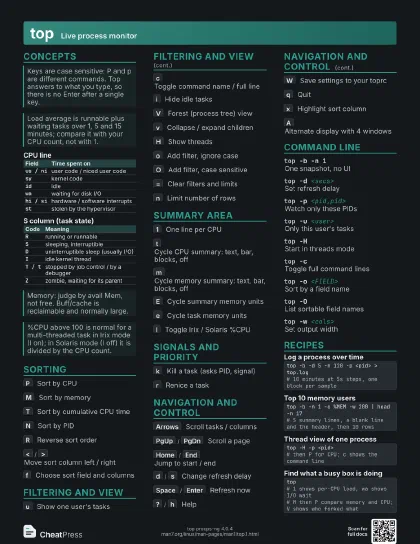
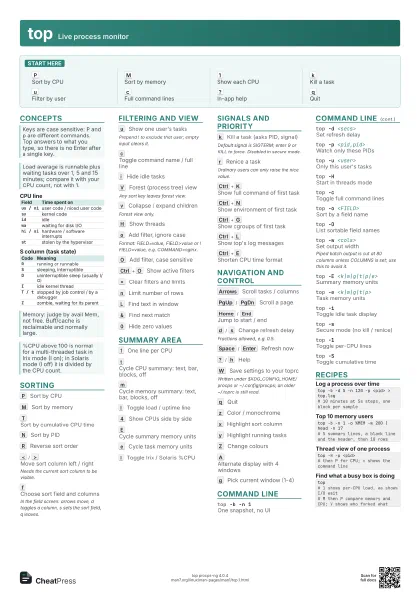
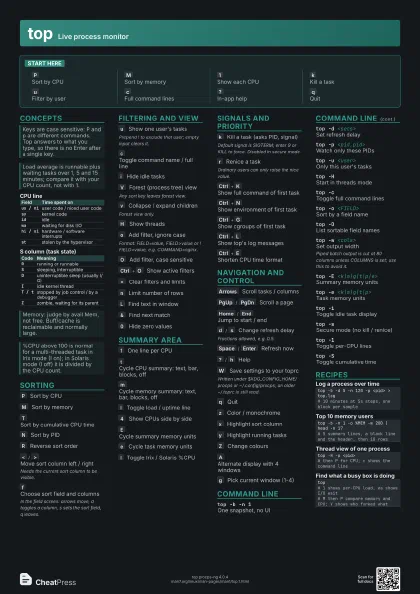
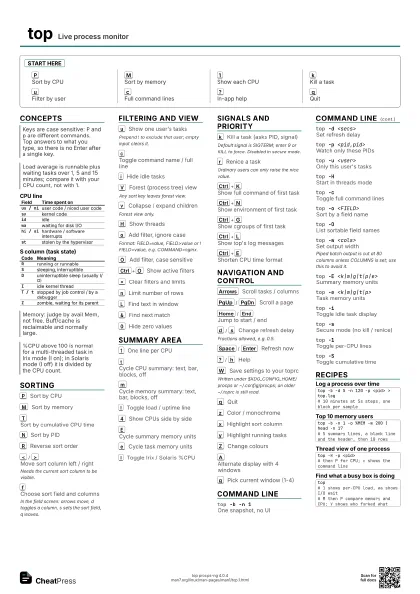
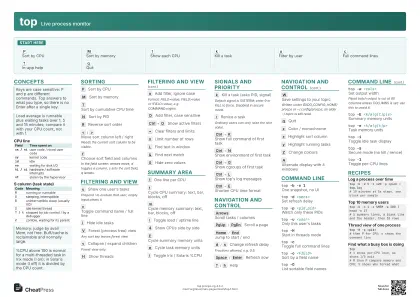
Start here
P
Sort by CPU
M
Sort by memory
1
Show each CPU
k
Kill a task
u
Filter by user
c
Full command lines
?
In-app help
q
Quit
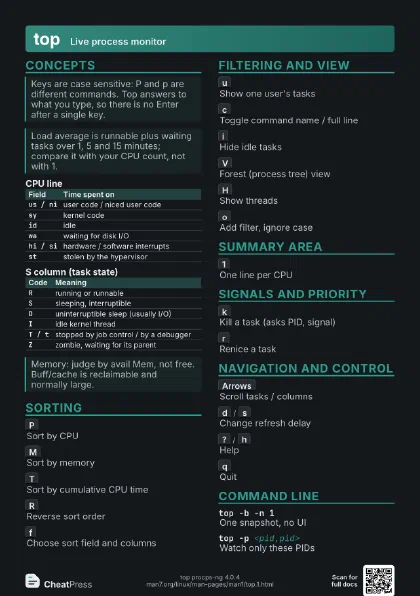
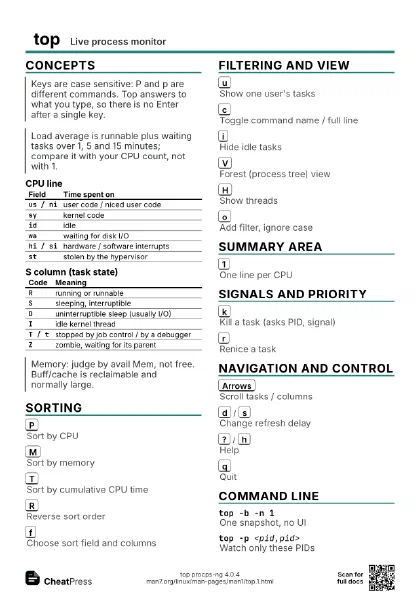
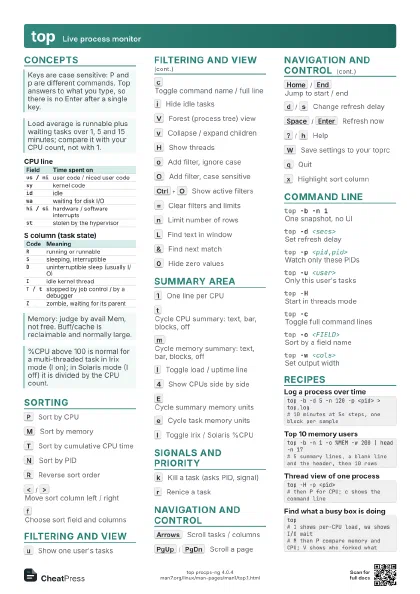
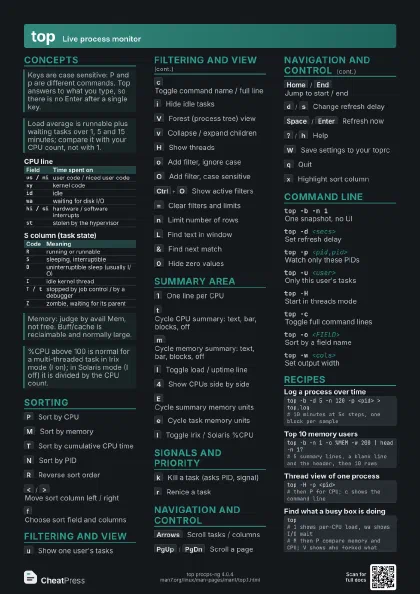
Concepts
| Field | Time spent on |
|---|---|
us / ni |
user code / niced user code |
sy |
kernel code |
id |
idle |
wa |
waiting for disk I/O |
hi / si |
hardware / software interrupts |
st |
stolen by the hypervisor |
| Code | Meaning |
|---|---|
R |
running or runnable |
S |
sleeping, interruptible |
D |
uninterruptible sleep (usually I/O) |
I |
idle kernel thread |
T / t |
stopped by job control / by a debugger |
Z |
zombie, waiting for its parent |
Sorting
P
Sort by CPU
M
Sort by memory
T
Sort by cumulative CPU time
N
Sort by PID
R
Reverse sort order
<
/
>
Move sort column left / right
Needs the current sort column to be visible.
f
Choose sort field and columns
In the field screen: arrows move, d toggles a column, s sets
the sort field, q leaves.
Filtering and view
u
Show one user's tasks
Prepend ! to exclude that user; empty input clears it.
c
Toggle command name / full line
i
Hide idle tasks
V
Forest (process tree) view
Any sort key leaves forest view.
v
Collapse / expand children
Forest view only.
H
Show threads
o
Add filter, ignore case
Format: FIELD=value, FIELD>value or !FIELD=value, e.g.
COMMAND=nginx.
O
Add filter, case sensitive
Ctrl+O
Show active filters
=
Clear filters and limits
n
Limit number of rows
L
Find text in window
&
Find next match
0
Hide zero values
Summary area
1
One line per CPU
t
Cycle CPU summary: text, bar, blocks, off
m
Cycle memory summary: text, bar, blocks, off
l
Toggle load / uptime line
4
Show CPUs side by side
E
Cycle summary memory units
e
Cycle task memory units
I
Toggle Irix / Solaris %CPU
Signals and priority
k
Kill a task (asks PID, signal)
Default signal is SIGTERM; enter 9 or KILL to force. Disabled
in secure mode.
r
Renice a task
Ordinary users can only raise the nice value.
Ctrl+K
Show full command of first task
Ctrl+N
Show environment of first task
Ctrl+G
Show cgroups of first task
Ctrl+L
Show top's log messages
Ctrl+E
Shorten CPU time format
Navigation and control
Arrows
Scroll tasks / columns
PgUp
/
PgDn
Scroll a page
Home
/
End
Jump to start / end
d
/
s
Change refresh delay
Fractions allowed, e.g. 0.5.
Space
/
Enter
Refresh now
?
/
h
Help
W
Save settings to your toprc
Written under $XDG_CONFIG_HOME/procps or ~/.config/procps; an
older ~/.toprc is still read.
q
Quit
z
Color / monochrome
x
Highlight sort column
y
Highlight running tasks
Z
Change colours
A
Alternate display with 4 windows
g
Pick current window (1-4)
Command line
top -b -n 1One snapshot, no UI
top -d <secs>
Set refresh delay
top -p <pid,pid>
Watch only these PIDs
top -u <user>
Only this user's tasks
top -HStart in threads mode
top -cToggle full command lines
top -o <FIELD>
Sort by a field name
top -OList sortable field names
top -w <cols>
Set output width
Piped batch output is cut at 80 columns unless COLUMNS is set;
use this to avoid it.
top -E <k|m|g|t|p|e>
Summary memory units
top -e <k|m|g|t|p>
Task memory units
top -iToggle idle task display
top -sSecure mode (no kill / renice)
top -1Toggle per-CPU lines
top -SToggle cumulative time
Recipes
top -b -d 5 -n 120 -p <pid> > top.log# 10 minutes at 5s steps, one block per sampletop -b -n 1 -o %MEM -w 200 | head -n 17# 5 summary lines, a blank line and the header, then 10 rowstop -H -p <pid># then P for CPU; c shows the command linetop# 1 shows per-CPU load, wa shows I/O wait# M then P compare memory and CPU; V shows who forked what