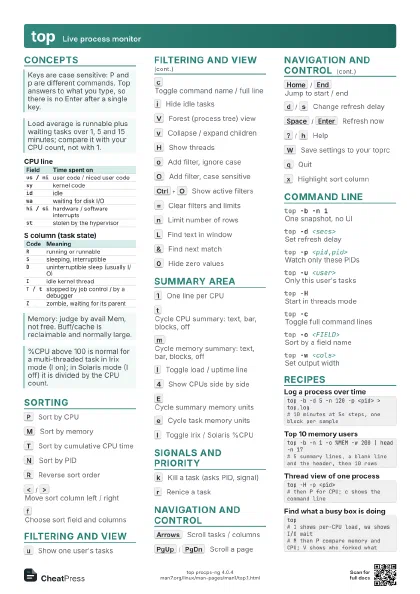
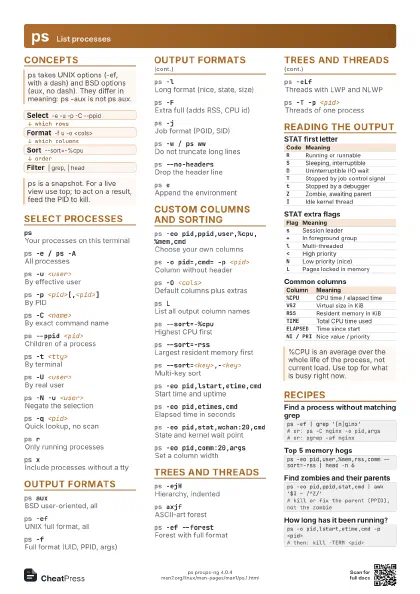
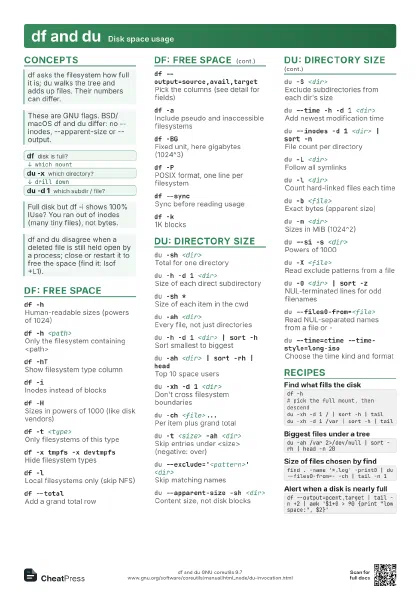
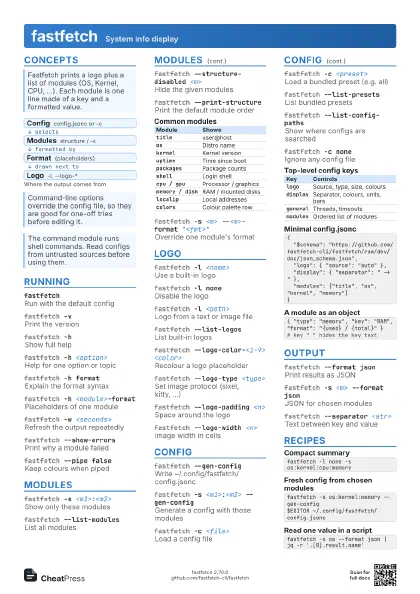
Cheat
System info Host, CPU, memory
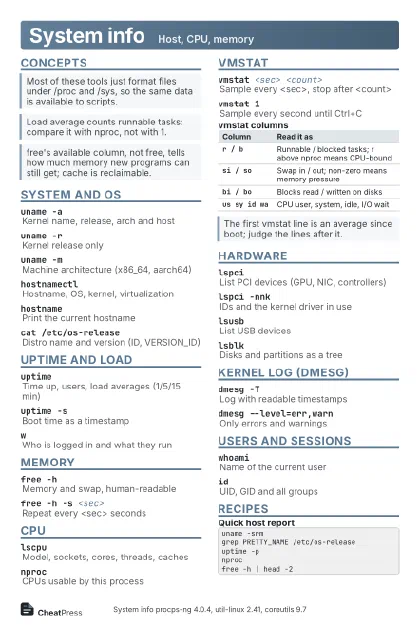 Light · Postcard
102 × 152 mm · PDF
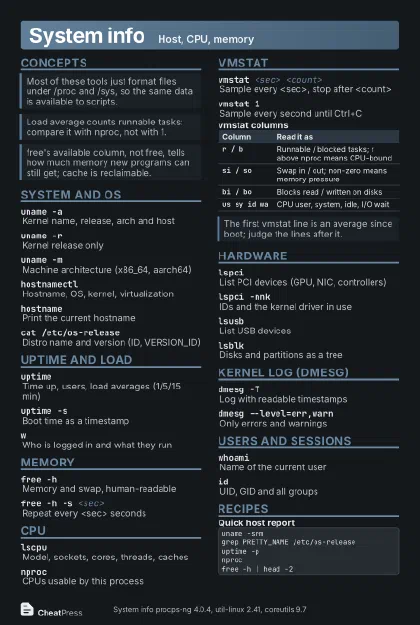 Dark · Postcard
102 × 152 mm · PDF
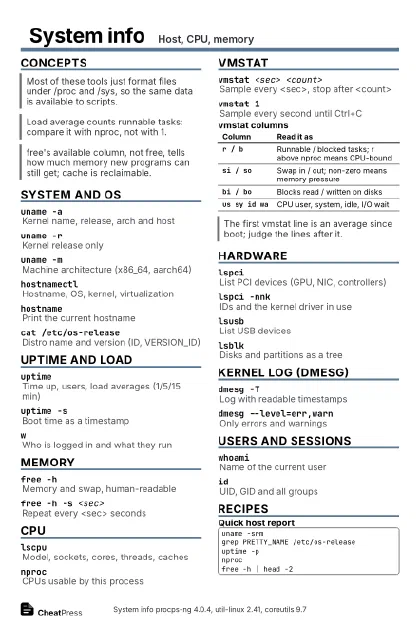 Ink saver · Postcard
102 × 152 mm · PDF
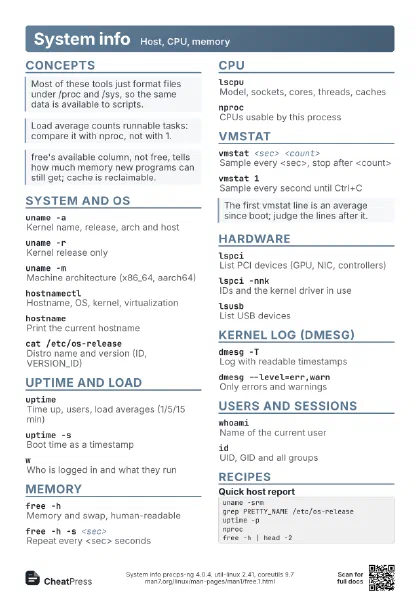
 Light · A4 landscape
297 × 210 mm · PDF
 Dark · A4 landscape
297 × 210 mm · PDF
 Ink saver · A4 landscape
297 × 210 mm · PDF
 Light · A3 landscape
420 × 297 mm · PDF
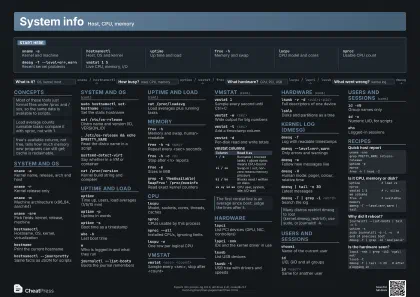 Dark · A3 landscape
420 × 297 mm · PDF
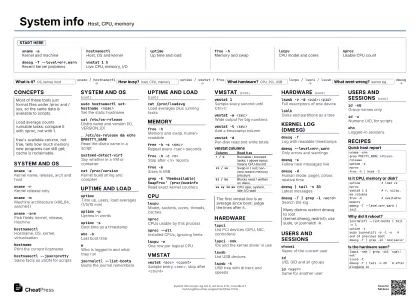 Ink saver · A3 landscape
420 × 297 mm · PDF
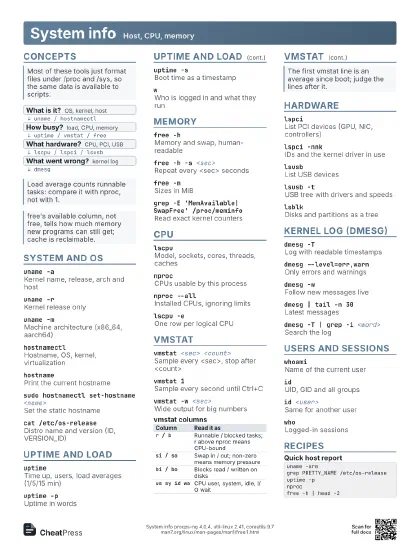
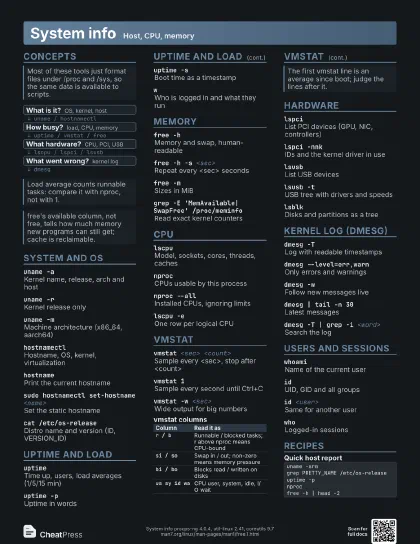
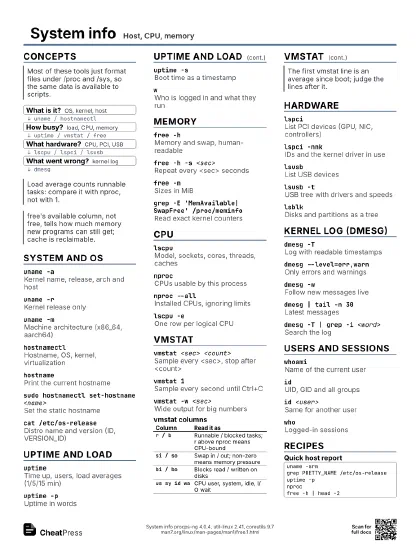
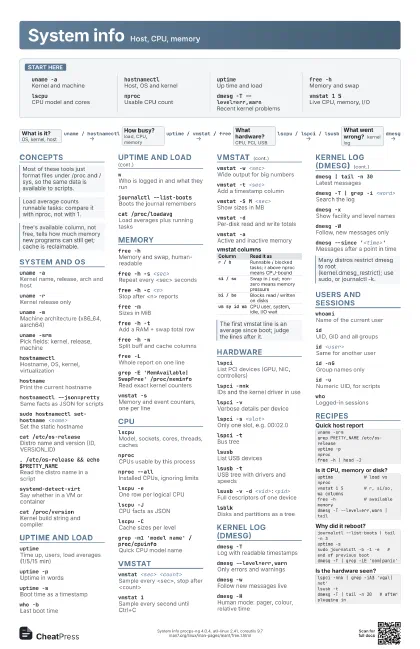
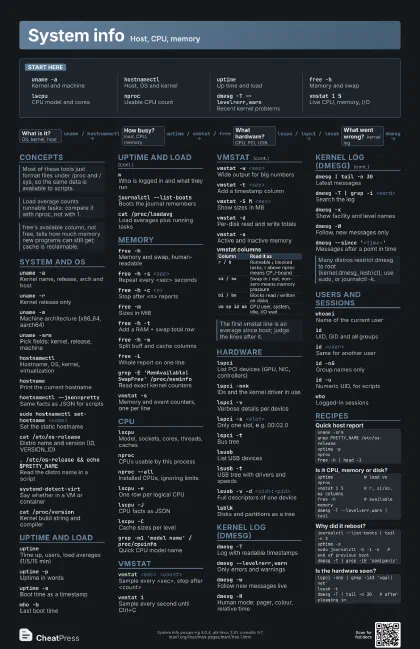
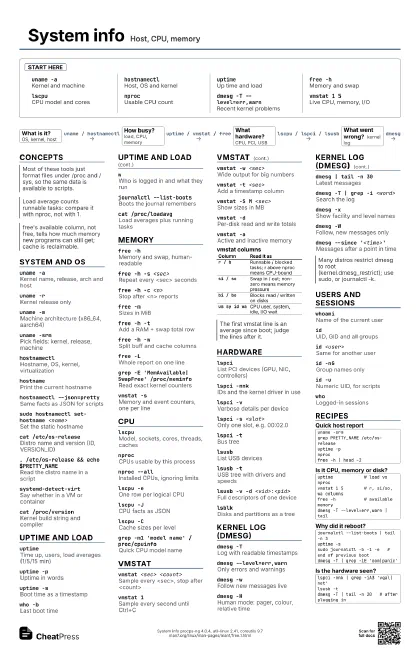
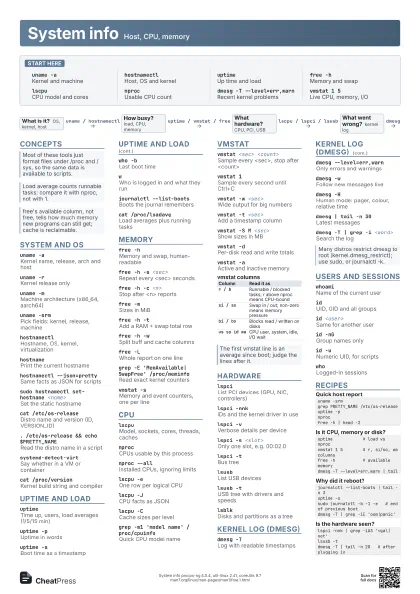
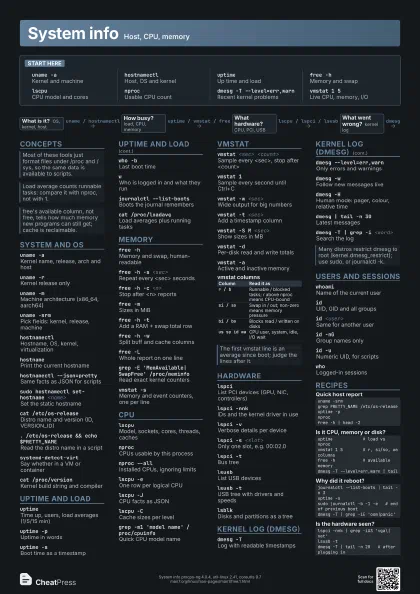
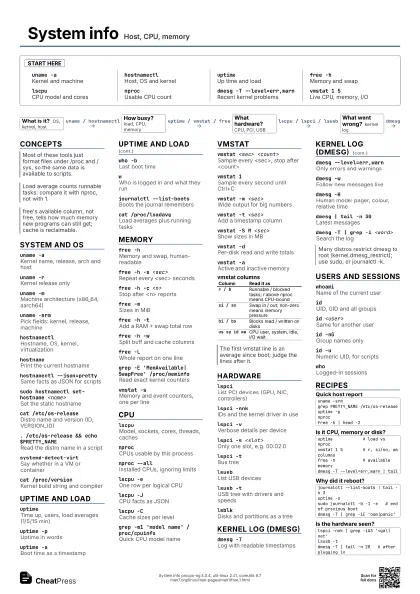
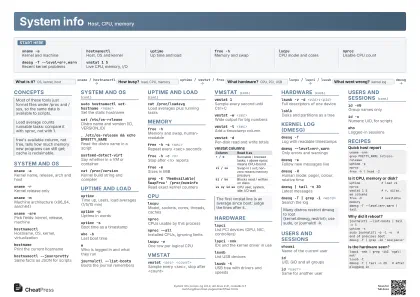
Start here
uname -aKernel and machine
hostnamectlHost, OS and kernel
uptimeUp time and load
free -hMemory and swap
lscpuCPU model and cores
nprocUsable CPU count
dmesg -T --level=err,warn
Recent kernel problems
vmstat 1 5Live CPU, memory, I/O
Concepts
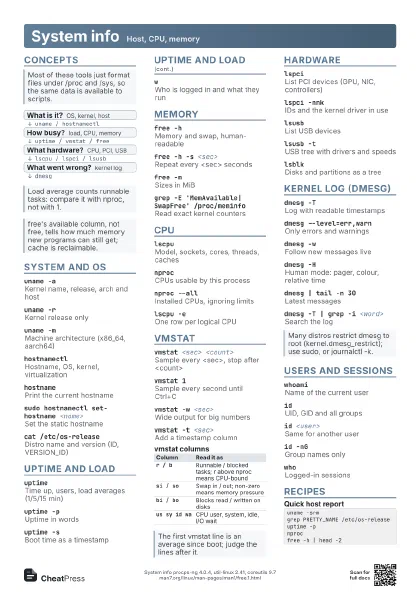
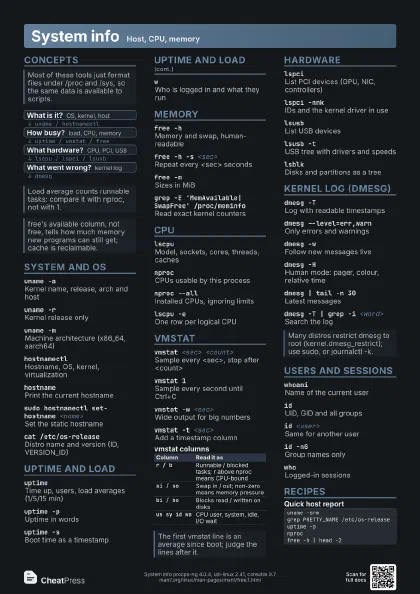
- What is it? OS, kernel, host
- How busy? load, CPU, memory
- What hardware? CPU, PCI, USB
- What went wrong? kernel log
System and OS
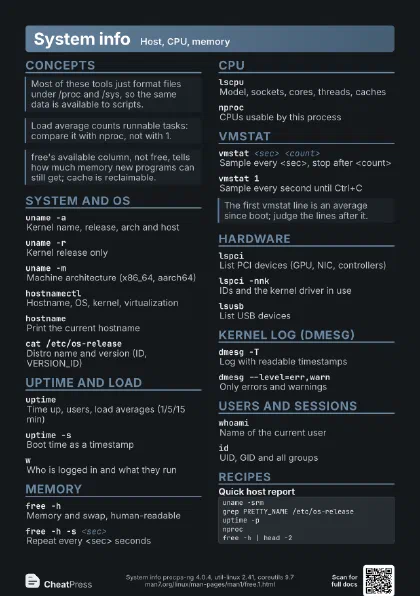
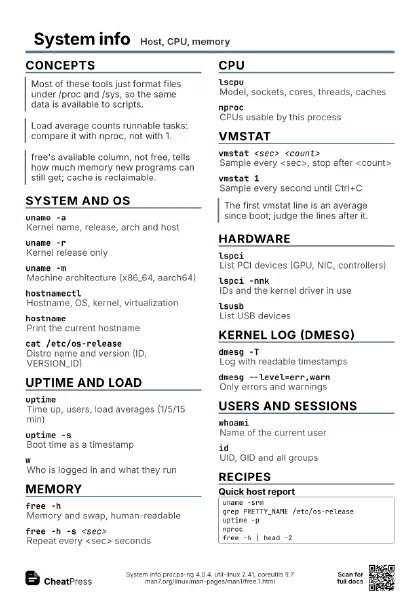
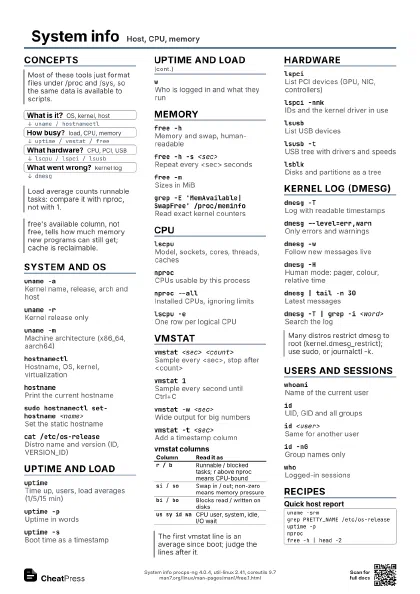
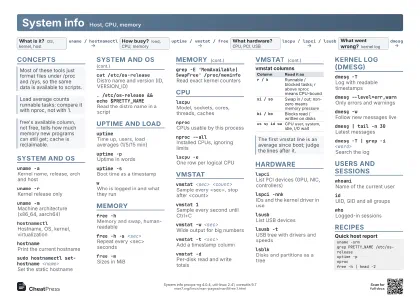
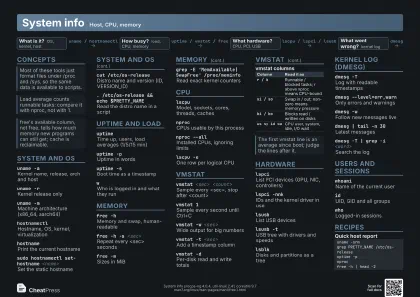
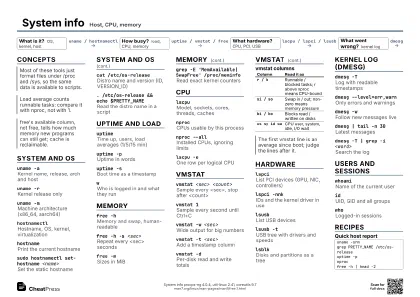
uname -aKernel name, release, arch and host
uname -rKernel release only
uname -mMachine architecture (x86_64, aarch64)
uname -srmPick fields: kernel, release, machine
hostnamectlHostname, OS, kernel, virtualization
hostnamePrint the current hostname
hostnamectl --json=pretty
Same facts as JSON for scripts
sudo hostnamectl set-hostname <name>
Set the static hostname
cat /etc/os-release
Distro name and version (ID, VERSION_ID)
. /etc/os-release && echo $PRETTY_NAME
Read the distro name in a script
systemd-detect-virt
Say whether in a VM or container
cat /proc/version
Kernel build string and compiler
Uptime and load
uptime
Time up, users, load averages (1/5/15 min)
uptime -pUptime in words
uptime -sBoot time as a timestamp
who -bLast boot time
wWho is logged in and what they run
journalctl --list-boots
Boots the journal remembers
cat /proc/loadavg
Load averages plus running tasks
Memory
free -hMemory and swap, human-readable
free -h -s <sec>
Repeat every <sec> seconds
free -h -c <n>
Stop after <n> reports
free -mSizes in MiB
free -h -tAdd a RAM + swap total row
free -h -wSplit buff and cache columns
free -LWhole report on one line
grep -E 'MemAvailable|SwapFree' /proc/meminfo
Read exact kernel counters
vmstat -sMemory and event counters, one per line
CPU
lscpuModel, sockets, cores, threads, caches
nprocCPUs usable by this process
nproc --allInstalled CPUs, ignoring limits
lscpu -eOne row per logical CPU
lscpu -JCPU facts as JSON
lscpu -CCache sizes per level
grep -m1 'model name' /proc/cpuinfo
Quick CPU model name
vmstat
vmstat <sec> <count>
Sample every <sec>, stop after <count>
vmstat 1Sample every second until Ctrl+C
vmstat -w <sec>
Wide output for big numbers
vmstat -t <sec>
Add a timestamp column
vmstat -S M <sec>
Show sizes in MB
vmstat -dPer-disk read and write totals
vmstat -aActive and inactive memory
| Column | Read it as |
|---|---|
r / b |
Runnable / blocked tasks; r above nproc means CPU-bound |
si / so |
Swap in / out; non-zero means memory pressure |
bi / bo |
Blocks read / written on disks |
us sy id wa |
CPU user, system, idle, I/O wait |
Hardware
lspciList PCI devices (GPU, NIC, controllers)
lspci -nnkIDs and the kernel driver in use
lspci -vVerbose details per device
lspci -s <slot>
Only one slot, e.g. 00:02.0
lspci -tBus tree
lsusbList USB devices
lsusb -tUSB tree with drivers and speeds
lsusb -v -d <vid>:<pid>
Full descriptors of one device
lsblkDisks and partitions as a tree
Kernel log (dmesg)
dmesg -TLog with readable timestamps
dmesg --level=err,warn
Only errors and warnings
dmesg -wFollow new messages live
dmesg -HHuman mode: pager, colour, relative time
dmesg | tail -n 30
Latest messages
dmesg -T | grep -i <word>
Search the log
dmesg -xShow facility and level names
dmesg -WFollow, new messages only
dmesg --since '<time>'
Messages after a point in time
dmesg -kKernel messages only
sudo dmesg -CClear the ring buffer
Users and sessions
whoamiName of the current user
idUID, GID and all groups
id <user>Same for another user
id -nGGroup names only
id -uNumeric UID, for scripts
whoLogged-in sessions
who -qNames and count of users
who -uSessions with idle time and PID
usersLogged-in user names on one line
loginctl list-sessions
Sessions as systemd sees them
Recipes
uname -srmgrep PRETTY_NAME /etc/os-releaseuptime -pnprocfree -h | head -2uptime # load vs nprocvmstat 1 5 # r, si/so, wa columnsfree -h # available memorydmesg -T --level=err,warn | tailjournalctl --list-boots | tail -n 3uptime -ssudo journalctl -b -1 -e # end of previous bootdmesg -T | grep -iE 'oom|panic'lspci -nnk | grep -iA3 'vga\|net'lsusb -tdmesg -T | tail -n 20 # after plugging in