Cheat
sysstat Performance statistics
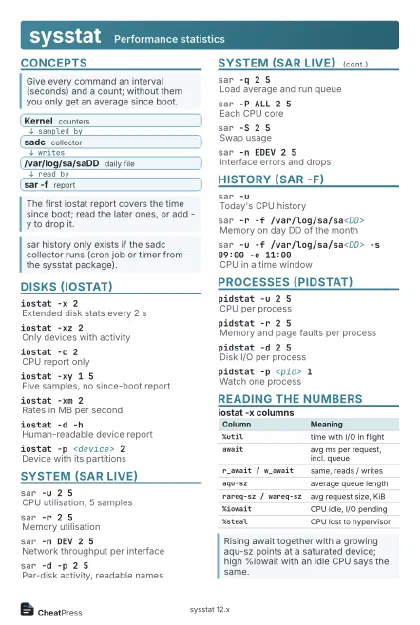 Light · Postcard
102 × 152 mm · PDF
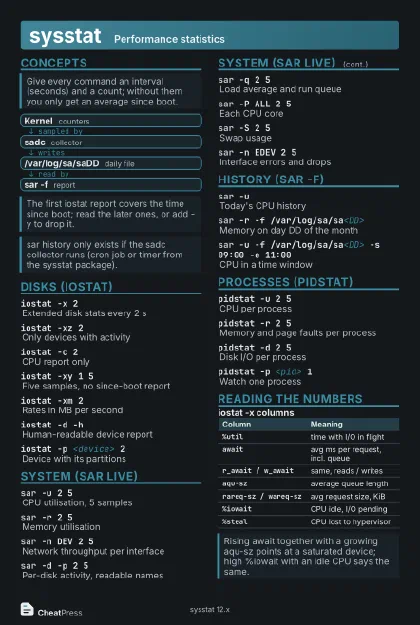 Dark · Postcard
102 × 152 mm · PDF
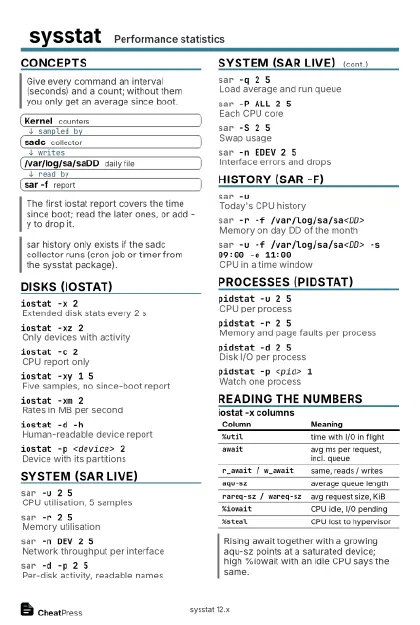 Ink saver · Postcard
102 × 152 mm · PDF
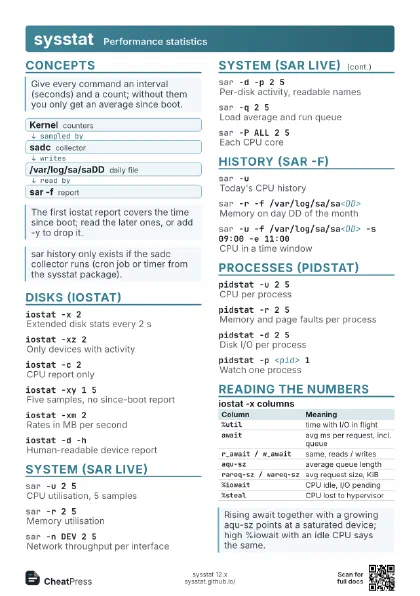
 Light · A4 landscape
297 × 210 mm · PDF
 Dark · A4 landscape
297 × 210 mm · PDF
 Ink saver · A4 landscape
297 × 210 mm · PDF
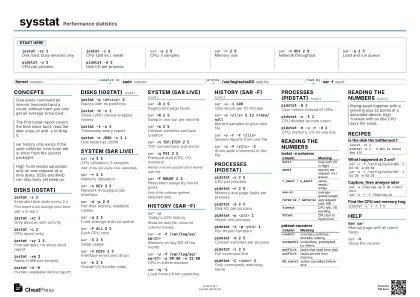
 Light · A3 landscape
420 × 297 mm · PDF
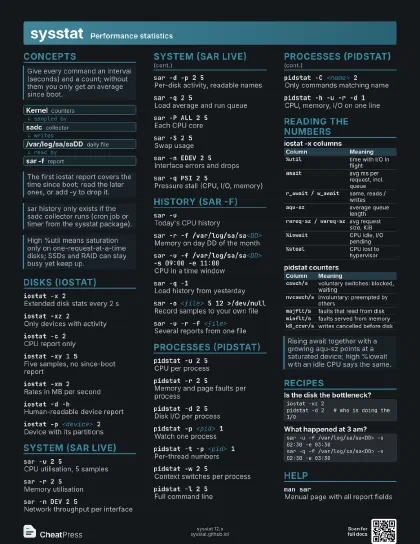
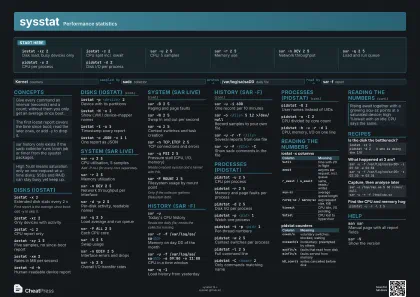 Dark · A3 landscape
420 × 297 mm · PDF
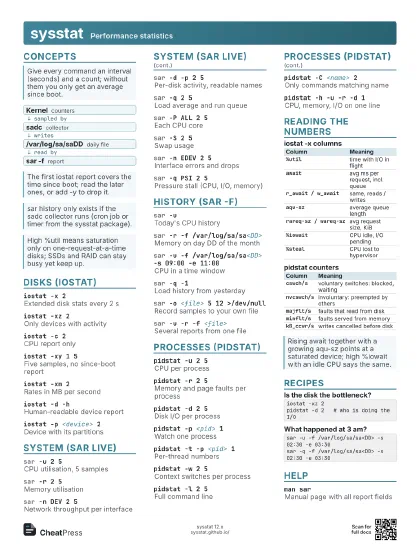
 Ink saver · A3 landscape
420 × 297 mm · PDF
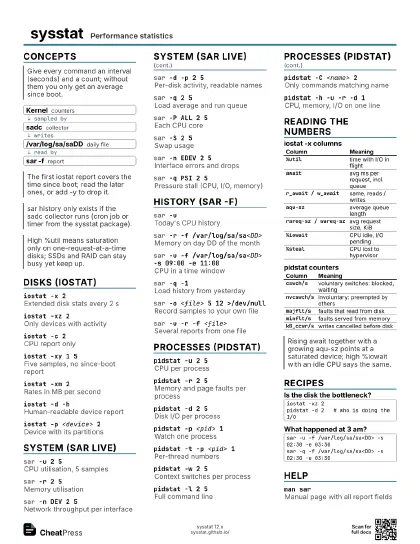
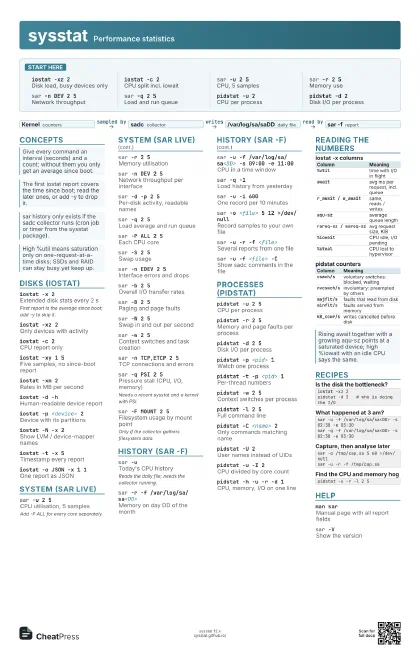
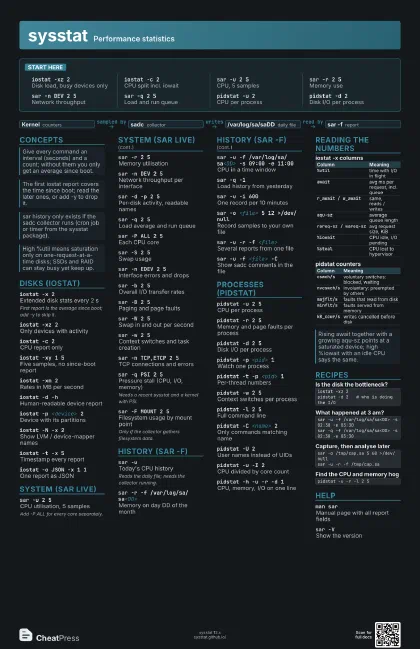
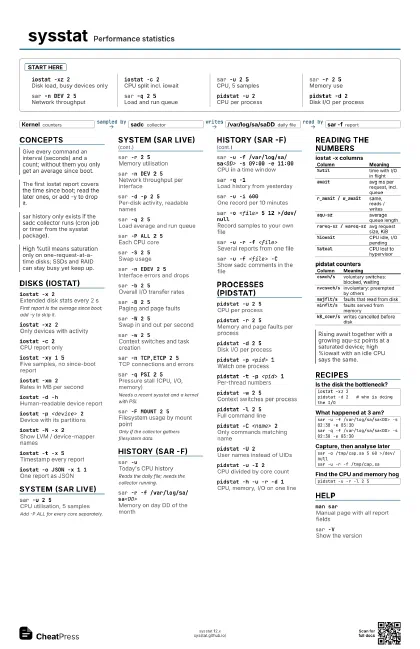
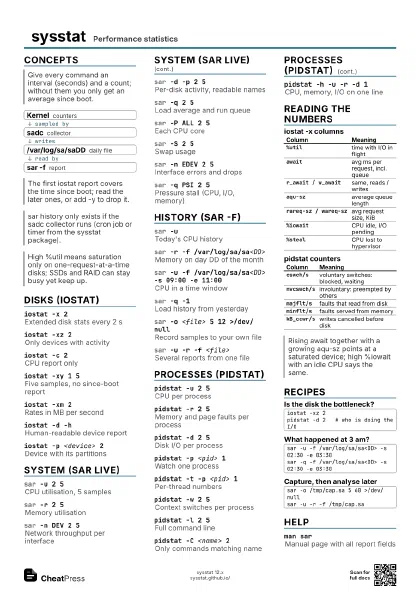
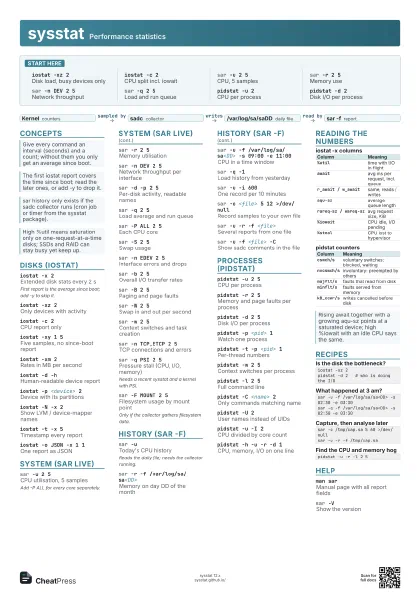
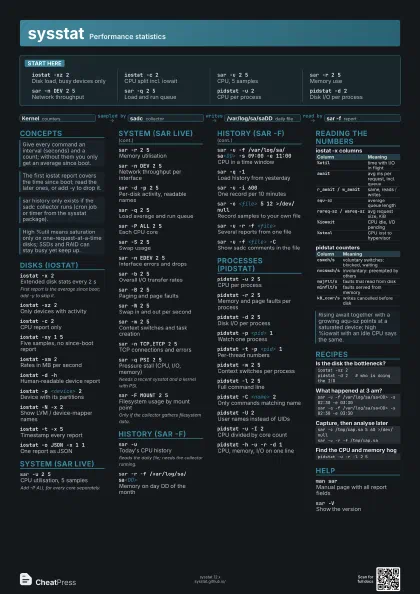
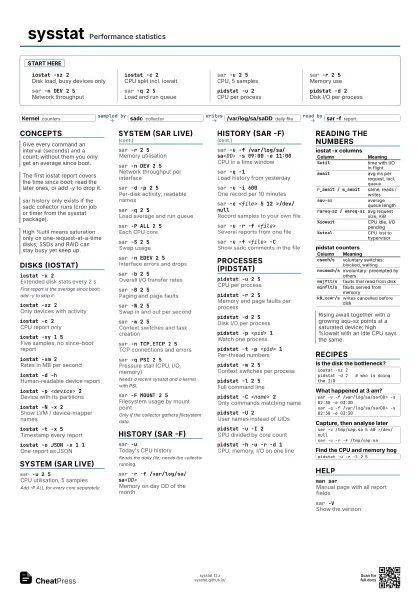
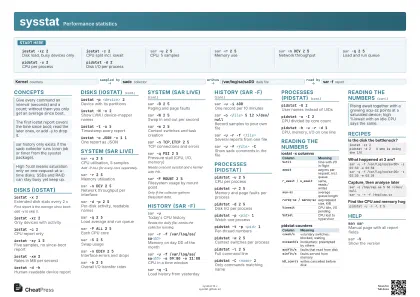
Start here
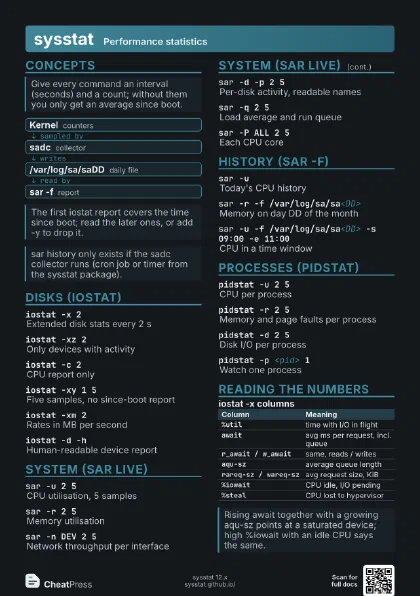
iostat -xz 2Disk load, busy devices only
iostat -c 2CPU split incl. iowait
sar -u 2 5CPU, 5 samples
sar -r 2 5Memory use
sar -n DEV 2 5Network throughput
sar -q 2 5Load and run queue
pidstat -u 2CPU per process
pidstat -d 2Disk I/O per process
Concepts
- Kernel counters
- sadc collector
- /var/log/sa/saDD daily file
- sar -f report
Disks (iostat)
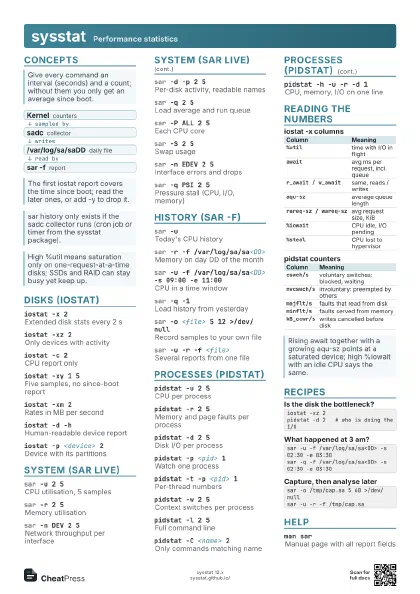
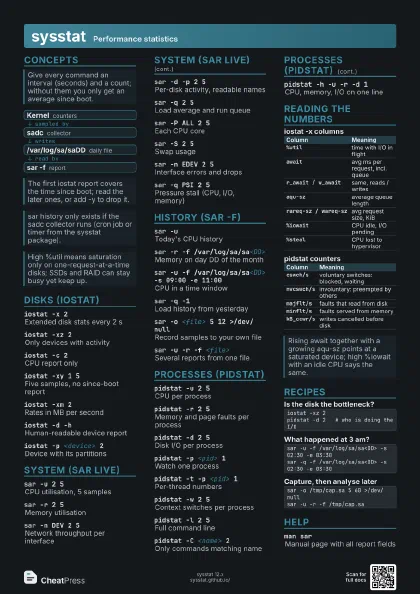
iostat -x 2Extended disk stats every 2 s
First report is the average since boot; add -y to skip it.
iostat -xz 2Only devices with activity
iostat -c 2CPU report only
iostat -xy 1 5Five samples, no since-boot report
iostat -xm 2Rates in MB per second
iostat -d -hHuman-readable device report
iostat -p <device> 2
Device with its partitions
iostat -N -x 2Show LVM / device-mapper names
iostat -t -x 5Timestamp every report
iostat -o JSON -x 1 1
One report as JSON
System (sar live)
sar -u 2 5CPU utilisation, 5 samples
Add -P ALL for every core separately.
sar -r 2 5Memory utilisation
sar -n DEV 2 5Network throughput per interface
sar -d -p 2 5Per-disk activity, readable names
sar -q 2 5Load average and run queue
sar -P ALL 2 5Each CPU core
sar -S 2 5Swap usage
sar -n EDEV 2 5Interface errors and drops
sar -b 2 5Overall I/O transfer rates
sar -B 2 5Paging and page faults
sar -W 2 5Swap in and out per second
sar -w 2 5Context switches and task creation
sar -n TCP,ETCP 2 5
TCP connections and errors
sar -q PSI 2 5Pressure stall (CPU, I/O, memory)
Needs a recent sysstat and a kernel with PSI.
sar -F MOUNT 2 5
Filesystem usage by mount point
Only if the collector gathers filesystem data.
History (sar -f)
sar -uToday's CPU history
Reads the daily file; needs the collector running.
sar -r -f /var/log/sa/sa<DD>
Memory on day DD of the month
sar -u -f /var/log/sa/sa<DD> -s 09:00 -e 11:00
CPU in a time window
sar -q -1Load history from yesterday
sar -u -i 600One record per 10 minutes
sar -o <file> 5 12 >/dev/null
Record samples to your own file
sar -u -r -f <file>
Several reports from one file
sar -u -f <file> -C
Show sadc comments in the file
Processes (pidstat)
pidstat -u 2 5CPU per process
pidstat -r 2 5Memory and page faults per process
pidstat -d 2 5Disk I/O per process
pidstat -p <pid> 1
Watch one process
pidstat -t -p <pid> 1
Per-thread numbers
pidstat -w 2 5Context switches per process
pidstat -l 2 5Full command line
pidstat -C <name> 2
Only commands matching name
pidstat -U 2User names instead of UIDs
pidstat -u -I 2CPU divided by core count
pidstat -h -u -r -d 1
CPU, memory, I/O on one line
Reading the numbers
| Column | Meaning |
|---|---|
%util |
time with I/O in flight |
await |
avg ms per request, incl. queue |
r_await / w_await |
same, reads / writes |
aqu-sz |
average queue length |
rareq-sz / wareq-sz |
avg request size, KiB |
%iowait |
CPU idle, I/O pending |
%steal |
CPU lost to hypervisor |
| Column | Meaning |
|---|---|
cswch/s |
voluntary switches: blocked, waiting |
nvcswch/s |
involuntary: preempted by others |
majflt/s |
faults that read from disk |
minflt/s |
faults served from memory |
kB_ccwr/s |
writes cancelled before disk |
Recipes
iostat -xz 2pidstat -d 2 # who is doing the I/Osar -u -f /var/log/sa/sa<DD> -s 02:30 -e 03:30sar -q -f /var/log/sa/sa<DD> -s 02:30 -e 03:30sar -o /tmp/cap.sa 5 60 >/dev/nullsar -u -r -f /tmp/cap.sapidstat -u -r -l 2 5Help
man sarManual page with all report fields
sar -VShow the version