Cheat
Prometheus PromQL and promtool
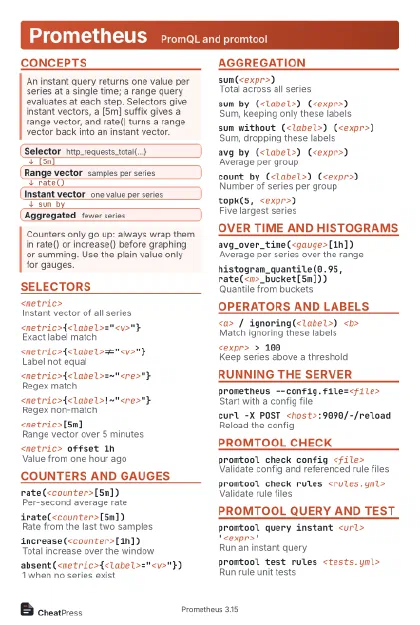 Light · Postcard
102 × 152 mm · PDF
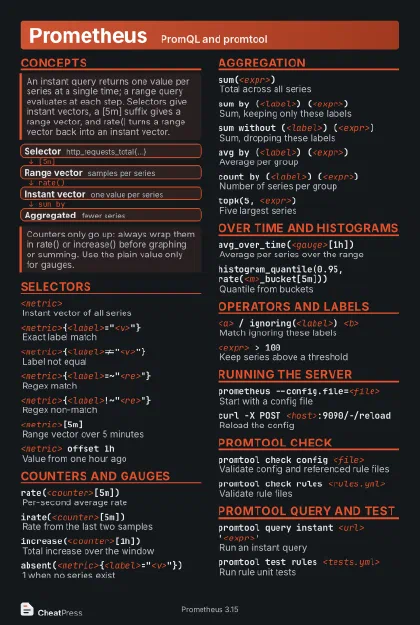 Dark · Postcard
102 × 152 mm · PDF
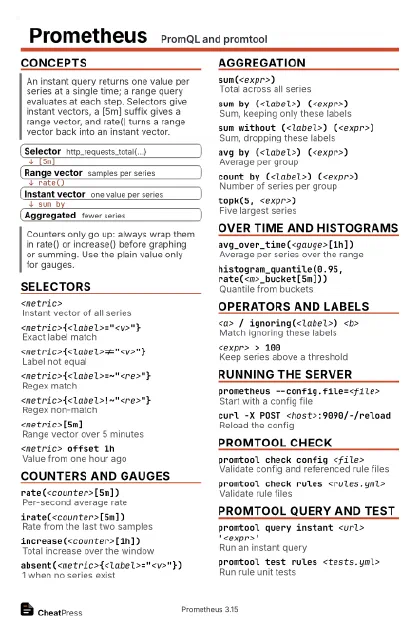 Ink saver · Postcard
102 × 152 mm · PDF
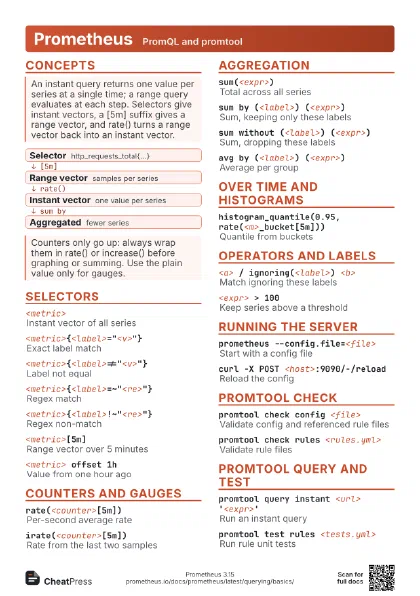
 Light · A4 landscape
297 × 210 mm · PDF
 Dark · A4 landscape
297 × 210 mm · PDF
 Ink saver · A4 landscape
297 × 210 mm · PDF
 Light · A3 landscape
420 × 297 mm · PDF
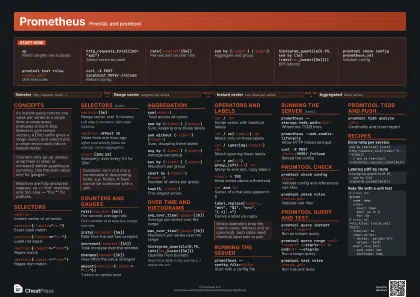 Dark · A3 landscape
420 × 297 mm · PDF
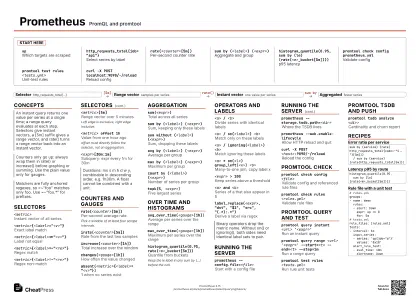 Ink saver · A3 landscape
420 × 297 mm · PDF
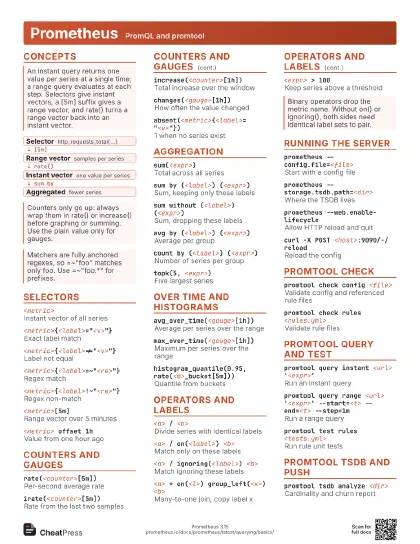
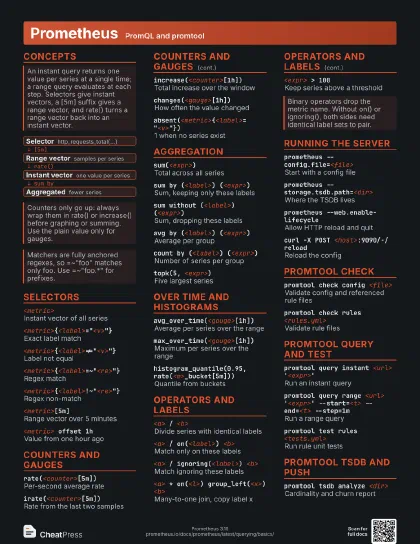
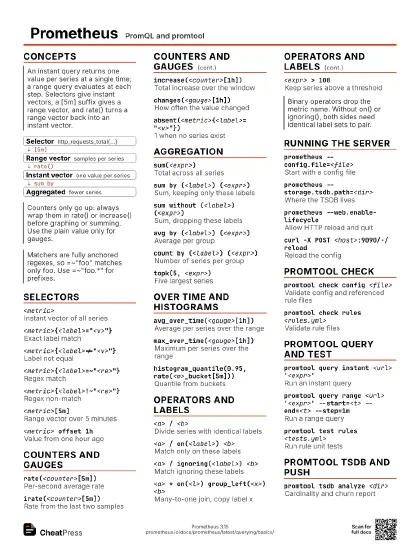
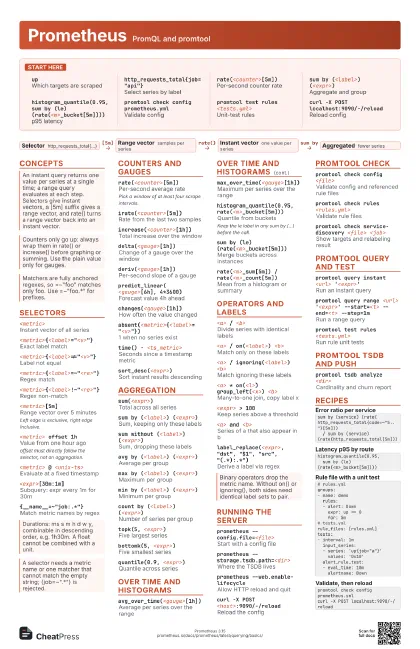
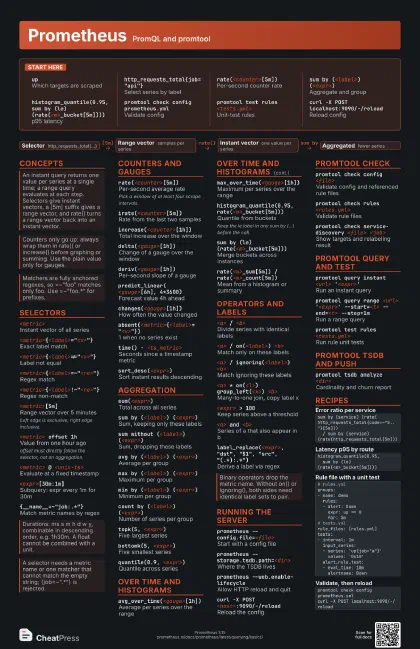
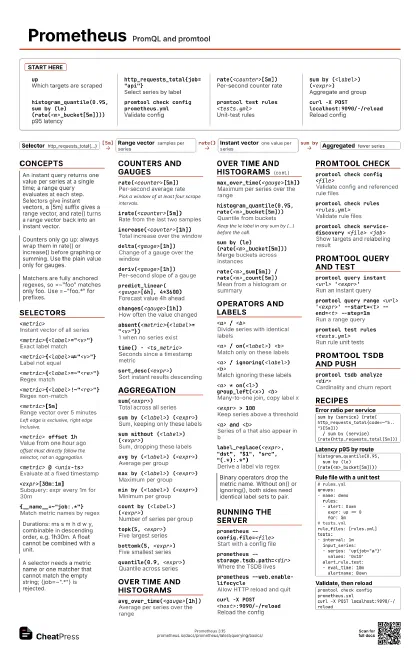
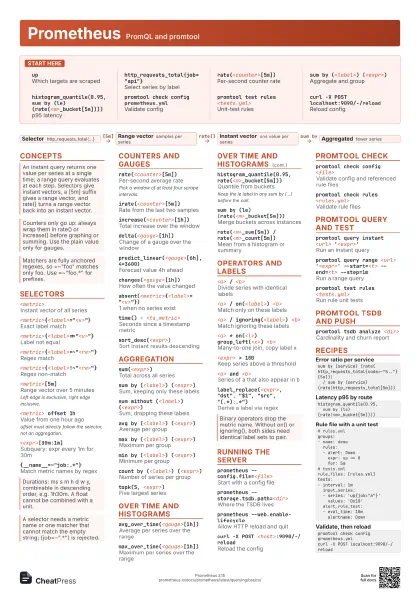
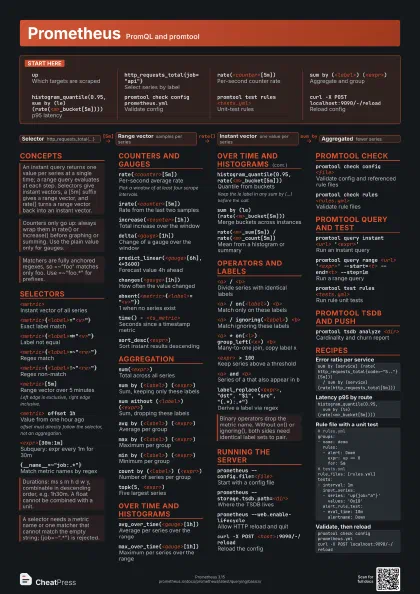
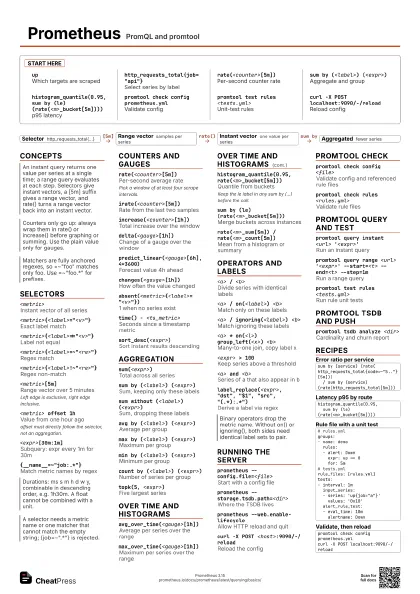
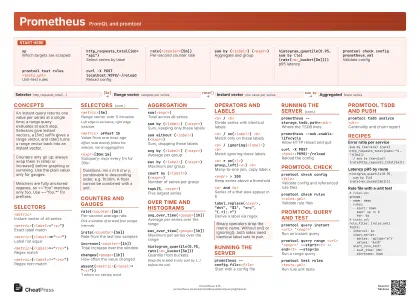
Start here
upWhich targets are scraped
http_requests_total{job="api"}
Select series by label
rate(<counter>[5m])
Per-second counter rate
sum by (<label>) (<expr>)
Aggregate and group
histogram_quantile(0.95, sum by (le)
                    (rate(<m>_bucket[5m])))
p95 latency
promtool check config prometheus.yml
Validate config
promtool test rules <tests.yml>
Unit-test rules
curl -X POST localhost:9090/-/reload
Reload config
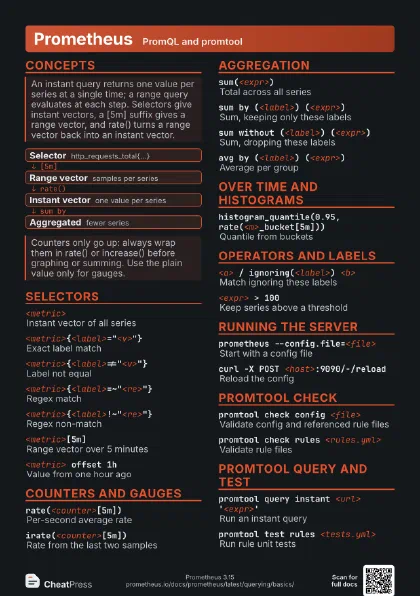
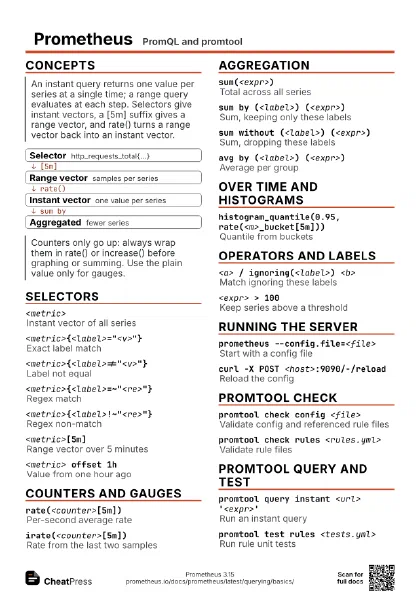
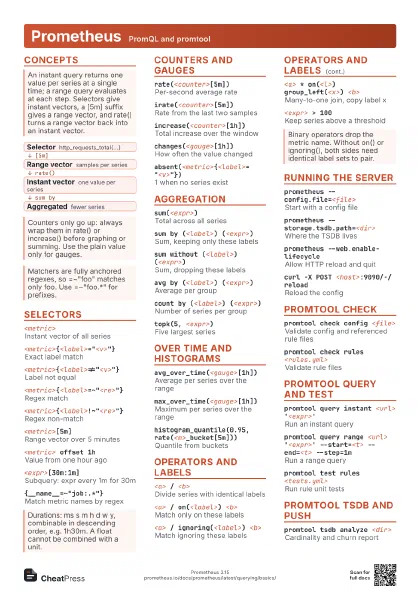
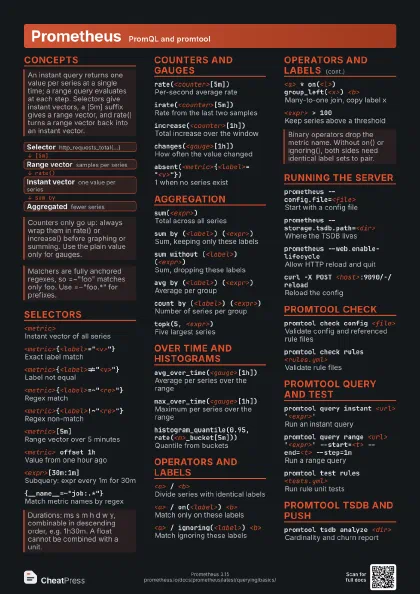
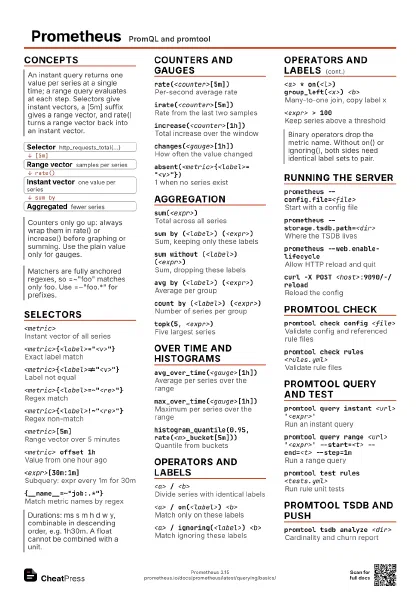
Concepts
- Selector http_requests_total{...}
- Range vector samples per series
- Instant vector one value per series
- Aggregated fewer series
Selectors
<metric>Instant vector of all series
<metric>{<label>="<v>"}
Exact label match
<metric>{<label>!="<v>"}
Label not equal
<metric>{<label>=~"<re>"}
Regex match
<metric>{<label>!~"<re>"}
Regex non-match
<metric>[5m]
Range vector over 5 minutes
Left edge is exclusive, right edge inclusive.
<metric> offset 1h
Value from one hour ago
offset must directly follow the selector, not an aggregation.
<metric> @ <unix-ts>
Evaluate at a fixed timestamp
<expr>[30m:1m]
Subquery: expr every 1m for 30m
{__name__=~"job:.*"}
Match metric names by regex
<expr> # comment
Line comment
Counters and gauges
rate(<counter>[5m])
Per-second average rate
Pick a window of at least four scrape intervals.
irate(<counter>[5m])
Rate from the last two samples
increase(<counter>[1h])
Total increase over the window
delta(<gauge>[1h])
Change of a gauge over the window
deriv(<gauge>[1h])
Per-second slope of a gauge
predict_linear(<gauge>[6h], 4*3600)
Forecast value 4h ahead
resets(<counter>[1h])
Counter resets in the window
changes(<gauge>[1h])
How often the value changed
absent(<metric>{<label>="<v>"})
1 when no series exist
absent_over_time(<metric>[1h])
1 when missing for the whole range
time() - <ts_metric>
Seconds since a timestamp metric
clamp_min(<expr>, 0)
Floor values at zero
round(<expr>, 0.1)
Round to nearest multiple
sort_desc(<expr>)
Sort instant results descending
Aggregation
sum(<expr>)
Total across all series
sum by (<label>) (<expr>)
Sum, keeping only these labels
sum without (<label>) (<expr>)
Sum, dropping these labels
avg by (<label>) (<expr>)
Average per group
max by (<label>) (<expr>)
Maximum per group
min by (<label>) (<expr>)
Minimum per group
count by (<label>) (<expr>)
Number of series per group
topk(5, <expr>)
Five largest series
bottomk(5, <expr>)
Five smallest series
quantile(0.9, <expr>)
Quantile across series
count_values("v", <expr>)
Count series per distinct value
group(<expr>)
1 per group, ignores values
stddev(<expr>)
Population standard deviation
Over time and histograms
avg_over_time(<gauge>[1h])
Average per series over the range
max_over_time(<gauge>[1h])
Maximum per series over the range
min_over_time(<gauge>[1h])
Minimum per series over the range
sum_over_time(<gauge>[1h])
Sum of samples per series
quantile_over_time(0.95, <gauge>[1h])
Quantile of samples per series
last_over_time(<metric>[1h])
Latest sample in range
histogram_quantile(0.95, rate(<m>_bucket[5m]))
Quantile from buckets
Keep the le label in any sum by (...) before the call.
sum by (le) (rate(<m>_bucket[5m]))
Merge buckets across instances
rate(<m>_sum[5m]) / rate(<m>_count[5m])
Mean from a histogram or summary
Operators and labels
<a> / <b>
Divide series with identical labels
<a> / on(<label>) <b>
Match only on these labels
<a> / ignoring(<label>) <b>
Match ignoring these labels
<a> * on(<l>) group_left(<x>)
                    <b>
Many-to-one join, copy label x
<expr> > 100
Keep series above a threshold
<expr> > bool 100
Return 1 or 0 instead of filtering
<a> and <b>
Series of a that also appear in b
<a> or <b>
Union of both sets
<a> unless <b>
Series of a that are not in b
label_replace(<expr>, "dst", "$1",
                    "src", "(.*):.*")
Derive a label via regex
label_join(<expr>, "dst", "-",
                    "a", "b")
Join label values
Running the server
prometheus --config.file=<file>
Start with a config file
prometheus --web.listen-address=<addr:port>
Change UI and API address
prometheus --storage.tsdb.path=<dir>
Where the TSDB lives
prometheus --storage.tsdb.retention.time=30d
Keep samples for 30 days
Default is 15 days when no retention setting is given.
prometheus --web.enable-lifecycle
Allow HTTP reload and quit
curl -X POST <host>:9090/-/reload
Reload the config
kill -HUP <pid>
Reload the config via signal
prometheus --web.enable-admin-api
Enable admin endpoints
prometheus --enable-feature=<name>
Turn on a feature flag
curl <host>:9090/-/healthy
Liveness check
curl <host>:9090/-/ready
Readiness check
promtool check
promtool check config <file>
Validate config and referenced rule files
promtool check config --syntax-only <file>
Skip checking referenced files
promtool check rules <rules.yml>
Validate rule files
promtool check rules --lint-fatal <rules.yml>
Fail on lint warnings
promtool check web-config <file>
Validate the web config
promtool check service-discovery <file>
                    <job>
Show targets and relabeling result
<exporter output> | promtool check metrics
Lint metric names and format
promtool check healthy --url=<url>
Check a server is healthy
promtool query and test
promtool query instant <url>
                    '<expr>'
Run an instant query
promtool query range <url> '<expr>'
                    --start=<t> --end=<t> --step=1m
Run a range query
promtool query series <url>
                    --match='<selector>'
List matching series
promtool query labels <url> <label>
List values of a label
promtool query analyze --server=<url>
Metric usage analysis (histograms)
promtool test rules <tests.yml>
Run rule unit tests
promtool test rules --run=<name>
                    <tests.yml>
Run only matching groups
promtool test rules --debug <tests.yml>
Print series evaluation detail
promtool promql format '<expr>'
Pretty-print a query
Experimental: requires promtool --experimental.
promtool tsdb and push
promtool tsdb list <dir>
List TSDB blocks
promtool tsdb analyze <dir>
Cardinality and churn report
promtool tsdb dump <dir>
                    --match='<selector>'
Dump samples as text
promtool tsdb create-blocks-from openmetrics <file>
                    <outdir>
Backfill from OpenMetrics
promtool tsdb create-blocks-from rules --start=<t>
                    --url=<url> <rules.yml>
Backfill recording rules
promtool push metrics <write-url> <file>
Send test data via remote write
promtool debug all <url>
Collect profiles and metrics
Recipes
sum by (service) (rate(http_requests_total{code=~"5.."}[5m])) / sum by (service) (rate(http_requests_total[5m]))histogram_quantile(0.95, sum by (le) (rate(<m>_bucket[5m])))# rules.ymlgroups:- name: demo rules: - alert: Down expr: up == 0 for: 5m# tests.ymlrule_files: [rules.yml]tests:- interval: 1m input_series: - series: 'up{job="a"}' values: '0x10' alert_rule_test: - eval_time: 10m alertname: Downpromtool check config prometheus.ymlcurl -X POST localhost:9090/-/reload