Cheat
promtool Prometheus CLI toolkit
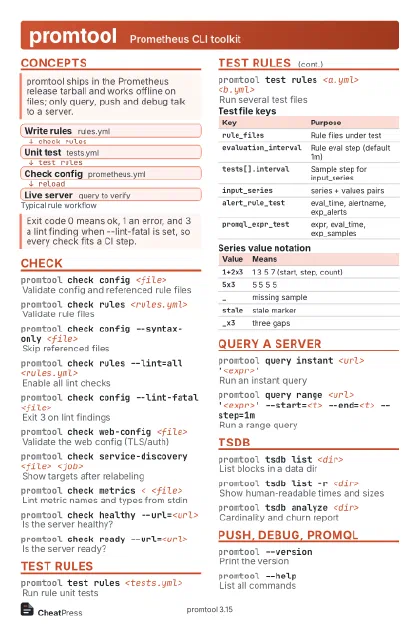 Light · Postcard
102 × 152 mm · PDF
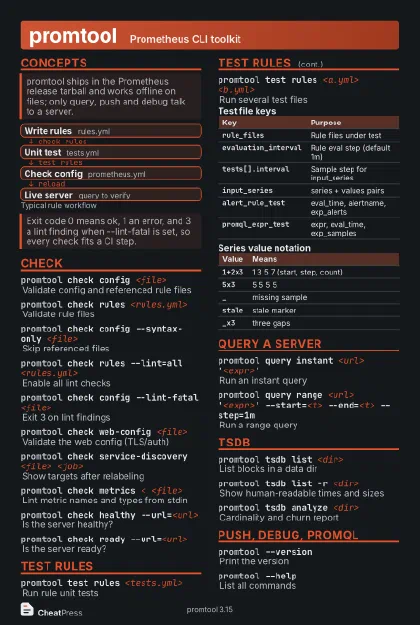 Dark · Postcard
102 × 152 mm · PDF
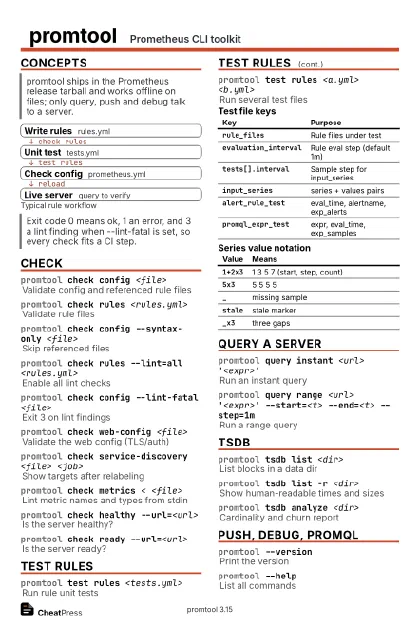 Ink saver · Postcard
102 × 152 mm · PDF
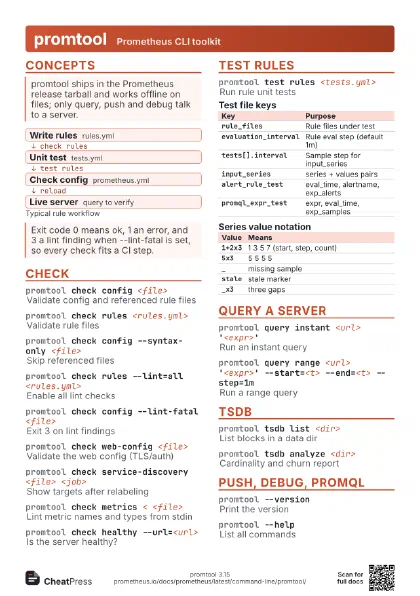
 Light · A4 landscape
297 × 210 mm · PDF
 Dark · A4 landscape
297 × 210 mm · PDF
 Ink saver · A4 landscape
297 × 210 mm · PDF
 Light · A3 landscape
420 × 297 mm · PDF
 Dark · A3 landscape
420 × 297 mm · PDF
 Ink saver · A3 landscape
420 × 297 mm · PDF
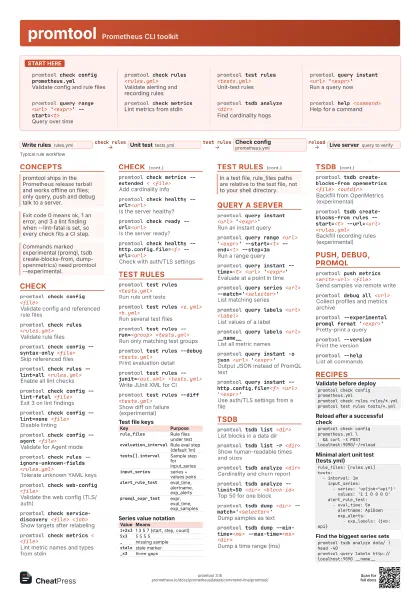
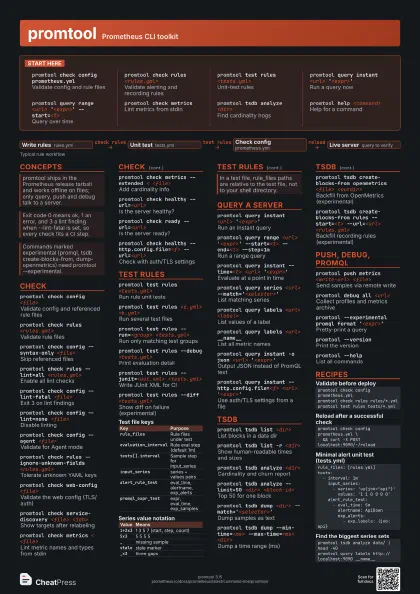
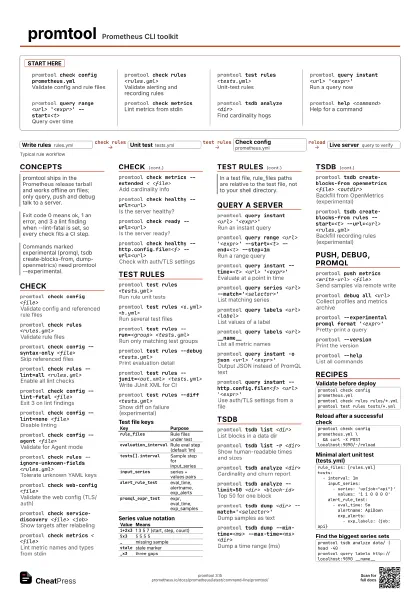
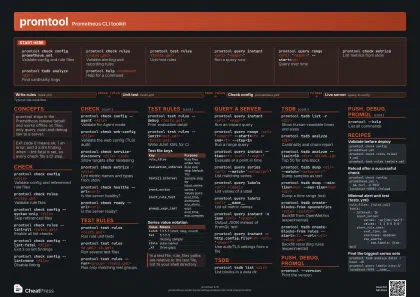
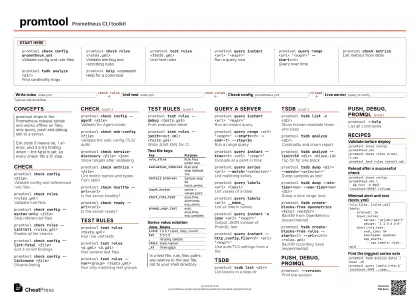
Start here
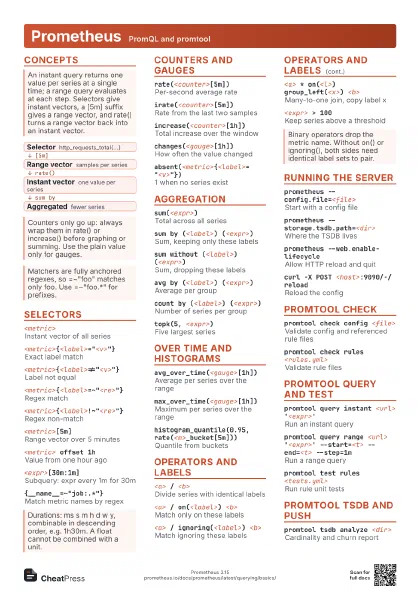
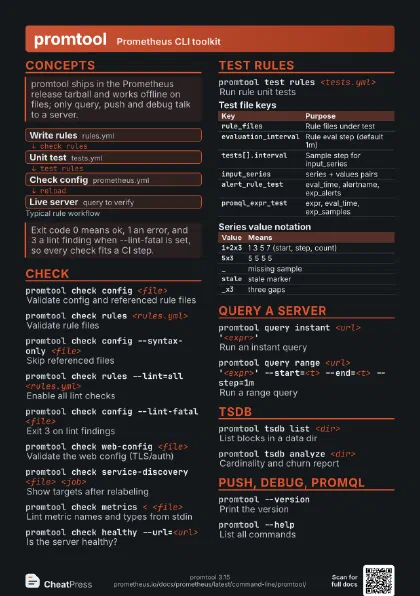
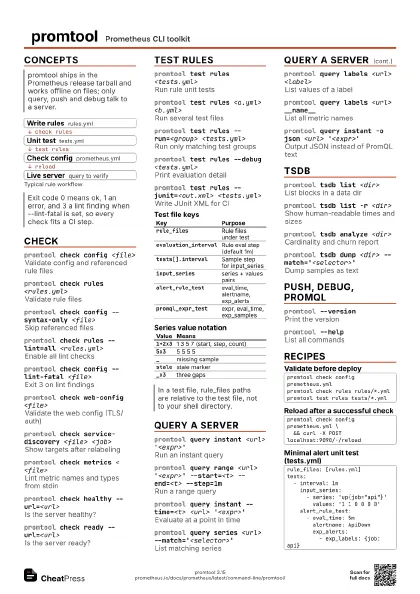
promtool check config prometheus.yml
Validate config and rule files
promtool check rules <rules.yml>
Validate alerting and recording rules
promtool test rules <tests.yml>
Unit-test rules
promtool query instant <url>
                    '<expr>'
Run a query now
promtool query range <url> '<expr>'
                    --start=<t>
Query over time
promtool check metrics
Lint metrics from stdin
promtool tsdb analyze <dir>
Find cardinality hogs
promtool help <command>
Help for a command
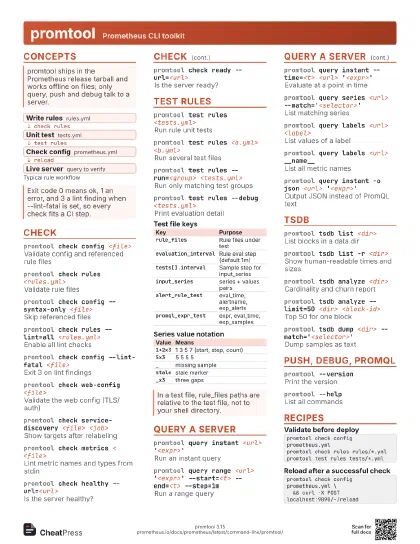
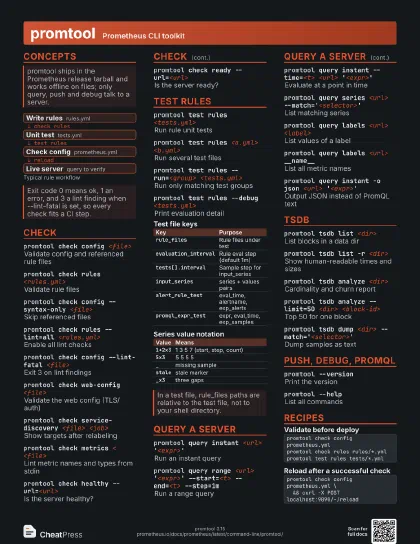
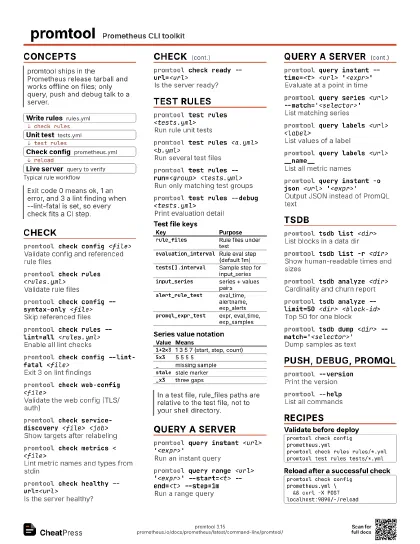
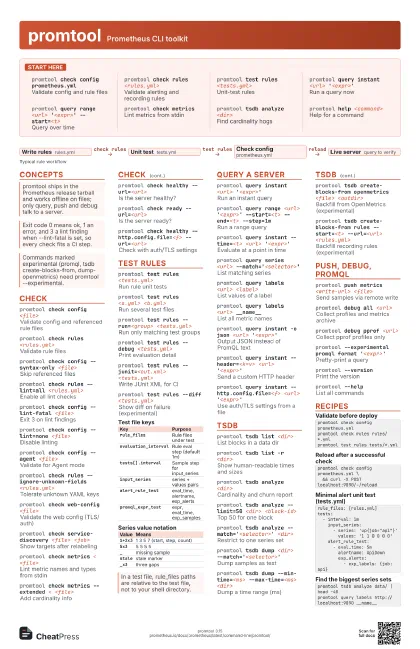
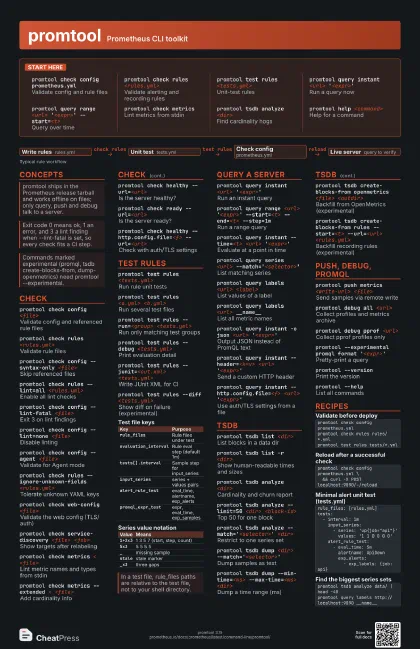
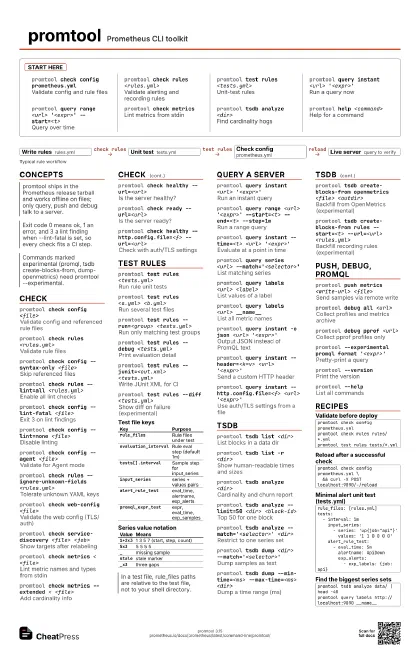
Concepts
- Write rules rules.yml
- Unit test tests.yml
- Check config prometheus.yml
- Live server query to verify
Check
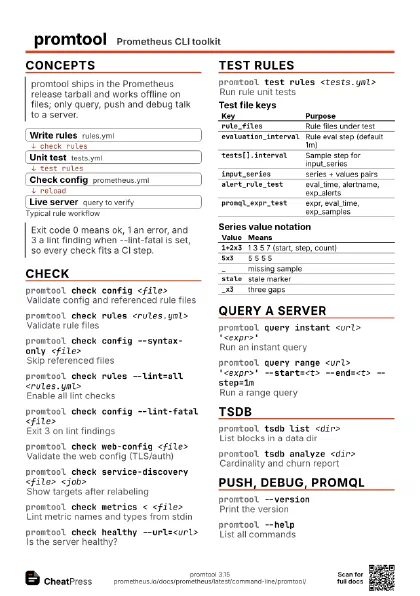
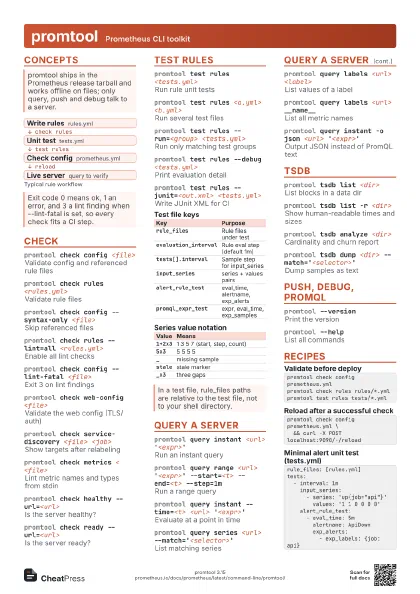
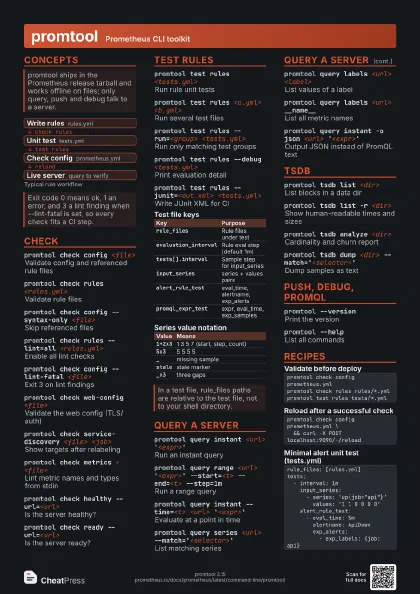
promtool check config <file>
Validate config and referenced rule files
promtool check rules <rules.yml>
Validate rule files
promtool check config --syntax-only <file>
Skip referenced files
promtool check rules --lint=all <rules.yml>
Enable all lint checks
promtool check config --lint-fatal <file>
Exit 3 on lint findings
promtool check config --lint=none <file>
Disable linting
promtool check config --agent <file>
Validate for Agent mode
promtool check rules --ignore-unknown-fields
                    <rules.yml>
Tolerate unknown YAML keys
promtool check web-config <file>
Validate the web config (TLS/auth)
promtool check service-discovery <file>
                    <job>
Show targets after relabeling
promtool check metrics < <file>
Lint metric names and types from stdin
promtool check metrics --extended < <file>
Add cardinality info
promtool check healthy --url=<url>
Is the server healthy?
promtool check ready --url=<url>
Is the server ready?
promtool check healthy --http.config.file=<f>
                    --url=<url>
Check with auth/TLS settings
Test rules
promtool test rules <tests.yml>
Run rule unit tests
promtool test rules <a.yml> <b.yml>
Run several test files
promtool test rules --run=<group>
                    <tests.yml>
Run only matching test groups
promtool test rules --debug <tests.yml>
Print evaluation detail
promtool test rules --junit=<out.xml>
                    <tests.yml>
Write JUnit XML for CI
promtool test rules --diff <tests.yml>
Show diff on failure (experimental)
| Key | Purpose |
|---|---|
rule_files |
Rule files under test |
evaluation_interval |
Rule eval step (default 1m) |
tests[].interval |
Sample step for input_series |
input_series |
series + values pairs |
alert_rule_test |
eval_time, alertname, exp_alerts |
promql_expr_test |
expr, eval_time, exp_samples |
| Value | Means |
|---|---|
1+2x3 |
1 3 5 7 (start, step, count) |
5x3 |
5 5 5 5 |
_ |
missing sample |
stale |
stale marker |
_x3 |
three gaps |
Query a server
promtool query instant <url>
                    '<expr>'
Run an instant query
promtool query range <url> '<expr>'
                    --start=<t> --end=<t> --step=1m
Run a range query
promtool query instant --time=<t> <url>
                    '<expr>'
Evaluate at a point in time
promtool query series <url>
                    --match='<selector>'
List matching series
promtool query labels <url> <label>
List values of a label
promtool query labels <url> __name__
List all metric names
promtool query instant -o json <url>
                    '<expr>'
Output JSON instead of PromQL text
promtool query instant --header=<k=v> <url>
                    '<expr>'
Send a custom HTTP header
promtool query instant --http.config.file=<f>
                    <url> '<expr>'
Use auth/TLS settings from a file
promtool query analyze --server=<url>
                    --type=histogram
Analyze histogram usage
promtool query analyze --server=<url>
                    --duration=<d> --match=<sel>
Limit the analysis window and series
TSDB
promtool tsdb list <dir>
List blocks in a data dir
promtool tsdb list -r <dir>
Show human-readable times and sizes
promtool tsdb analyze <dir>
Cardinality and churn report
promtool tsdb analyze --limit=50 <dir>
                    <block-id>
Top 50 for one block
promtool tsdb analyze --match='<selector>'
                    <dir>
Restrict to one series set
promtool tsdb dump <dir>
                    --match='<selector>'
Dump samples as text
promtool tsdb dump --format=seriesjson <dir>
Dump series as JSON
promtool tsdb dump --min-time=<ms>
                    --max-time=<ms> <dir>
Dump a time range (ms)
promtool tsdb dump-openmetrics <dir>
Dump as OpenMetrics (experimental)
promtool tsdb create-blocks-from openmetrics <file>
                    <outdir>
Backfill from OpenMetrics (experimental)
promtool tsdb create-blocks-from rules --start=<t>
                    --url=<url> <rules.yml>
Backfill recording rules (experimental)
promtool tsdb create-blocks-from rules
                    --eval-interval=<d> --output-dir=<dir>
                    <rules.yml>
Set backfill step and output dir
promtool tsdb bench write --metrics=<n>
                    --scrapes=<n> <file>
Benchmark TSDB writes
Push, debug, PromQL
promtool push metrics <write-url> <file>
Send samples via remote write
promtool push metrics --label=<k=v> <write-url>
                    < <file>
Add a label; read stdin
promtool debug all <url>
Collect profiles and metrics archive
promtool debug pprof <url>
Collect pprof profiles only
promtool debug metrics <url>
Collect metrics only
promtool --experimental promql format
                    '<expr>'
Pretty-print a query
promtool --experimental promql label-matchers set
                    <query> <name> <value>
Set a label matcher in a query
promtool --experimental promql label-matchers delete
                    <query> <name>
Remove a label matcher
promtool --version
Print the version
promtool --helpList all commands
promtool --enable-feature=<name>
                    <command>
Enable a feature flag
Recipes
promtool check config prometheus.ymlpromtool check rules rules/*.ymlpromtool test rules tests/*.ymlpromtool check config prometheus.yml \ && curl -X POST localhost:9090/-/reloadrule_files: [rules.yml]tests: - interval: 1m input_series: - series: 'up{job="api"}' values: '1 1 0 0 0 0' alert_rule_test: - eval_time: 5m alertname: ApiDown exp_alerts: - exp_labels: {job: api}promtool tsdb analyze data/ | head -40promtool query labels http://localhost:9090 __name__