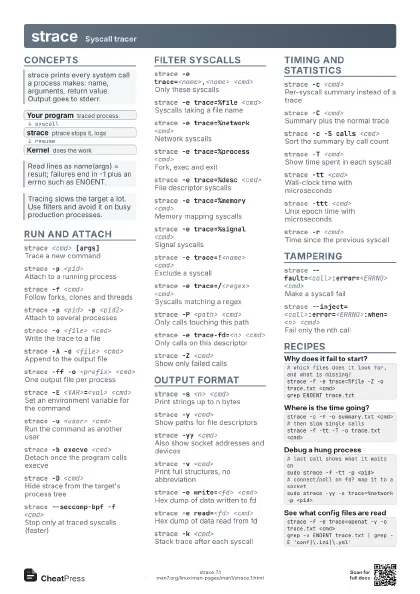
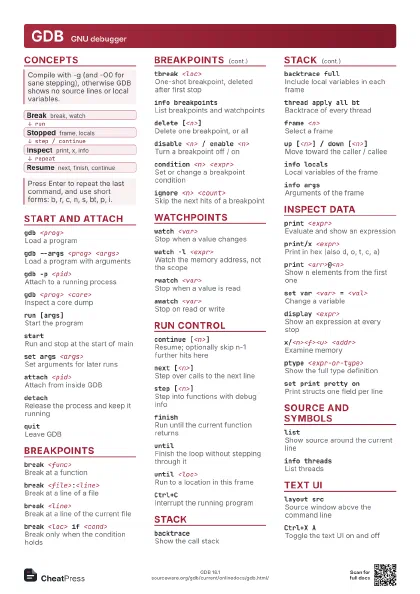
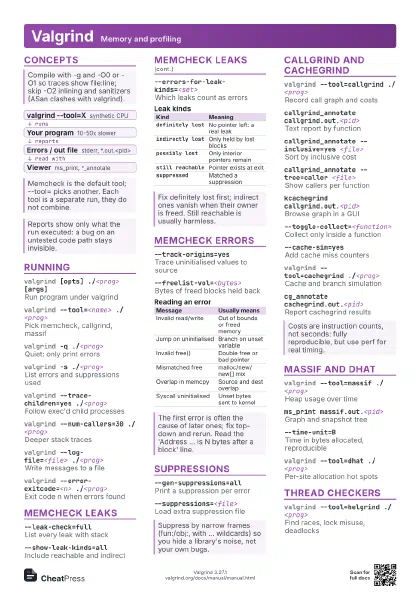
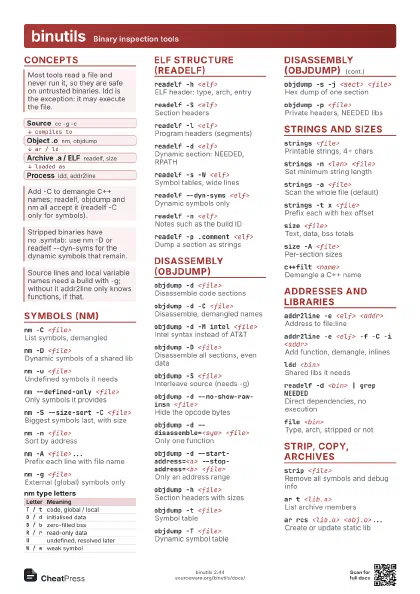
Cheat
ltrace Library call tracer
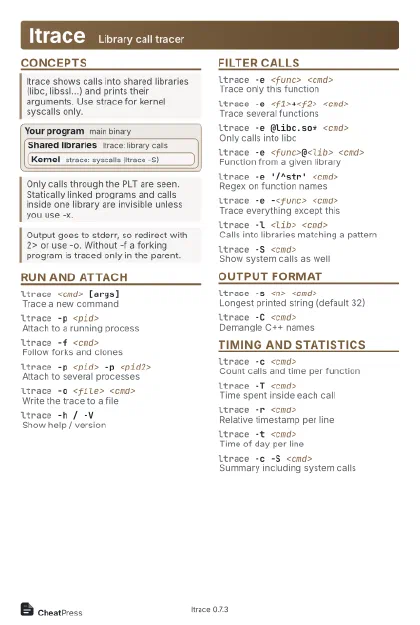 Light · Postcard
102 × 152 mm · PDF
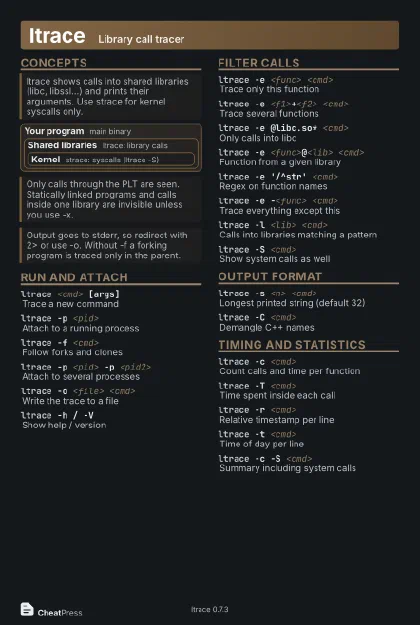 Dark · Postcard
102 × 152 mm · PDF
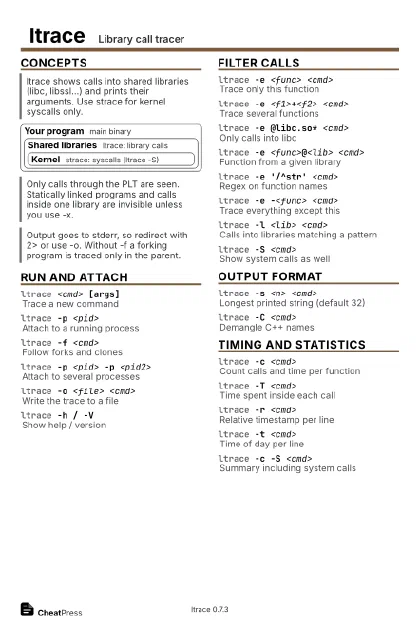 Ink saver · Postcard
102 × 152 mm · PDF
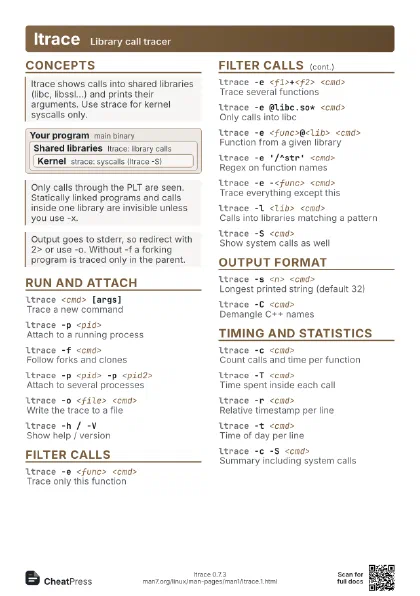
 Light · A4 landscape
297 × 210 mm · PDF
 Dark · A4 landscape
297 × 210 mm · PDF
 Ink saver · A4 landscape
297 × 210 mm · PDF
 Light · A3 landscape
420 × 297 mm · PDF
 Dark · A3 landscape
420 × 297 mm · PDF
 Ink saver · A3 landscape
420 × 297 mm · PDF
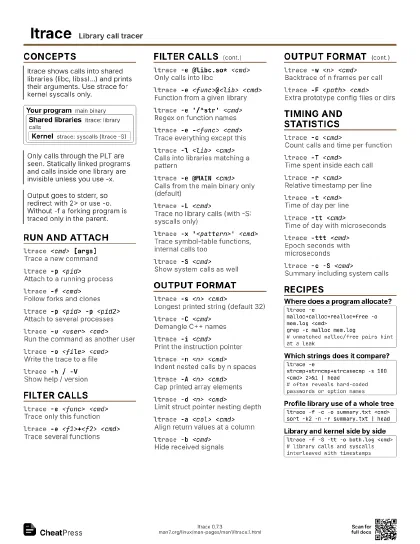
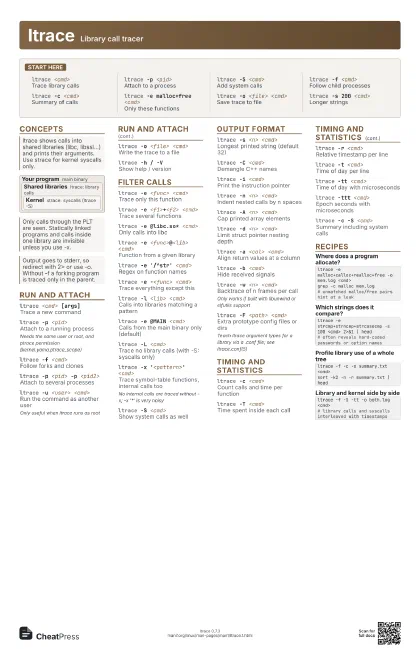
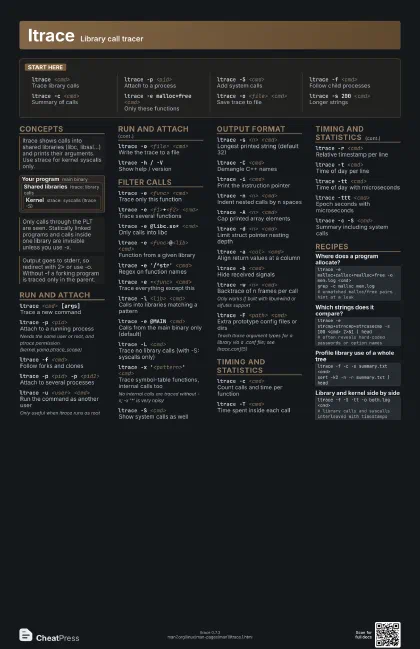
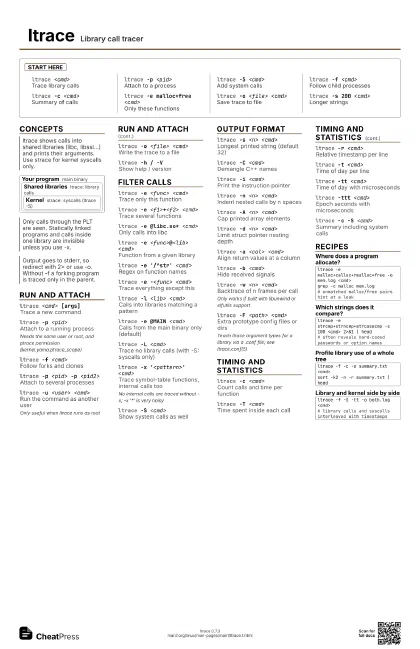
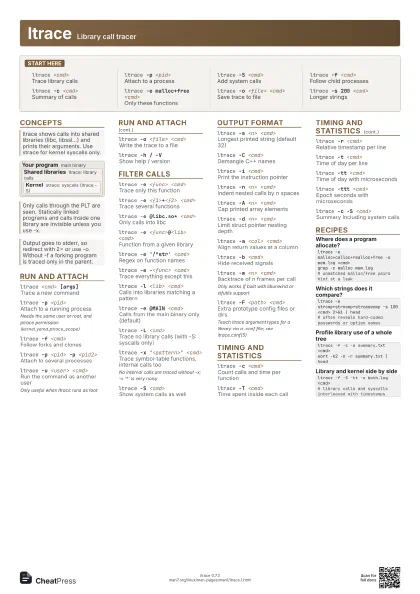
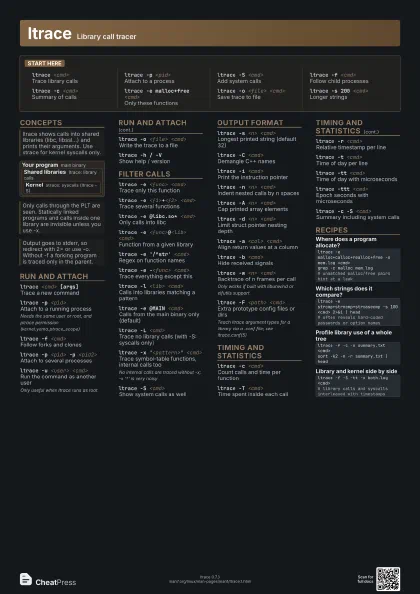
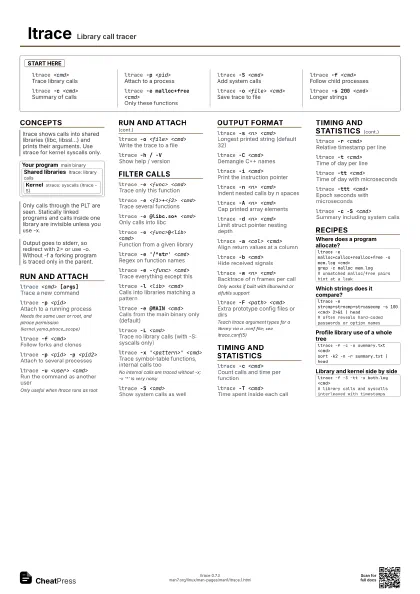
Start here
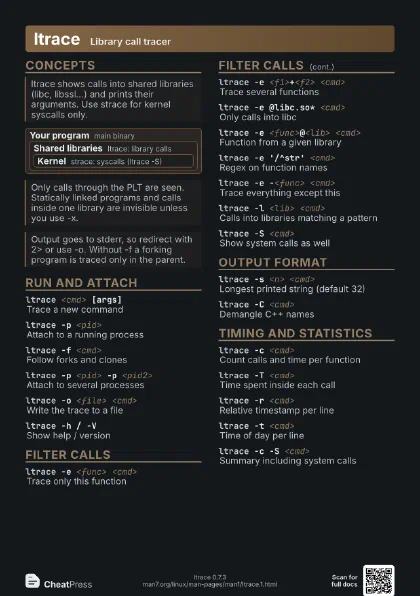
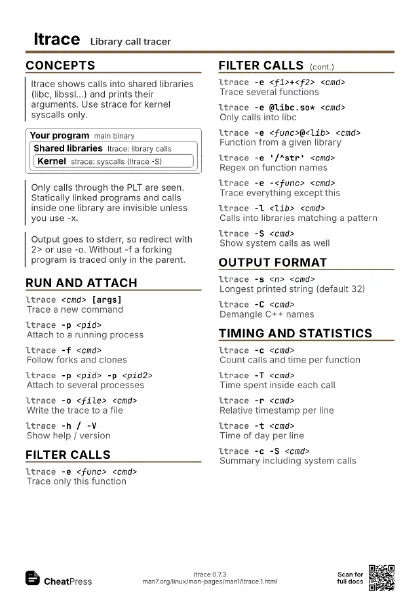
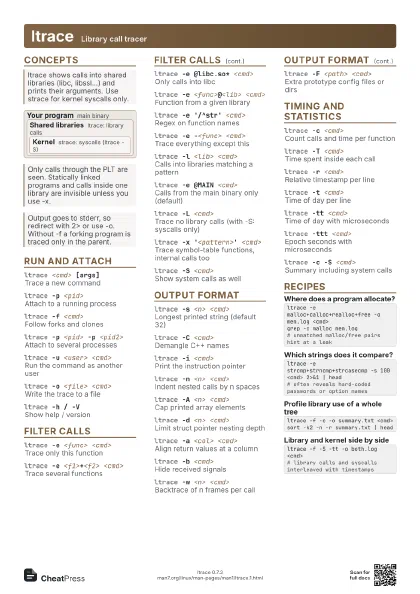
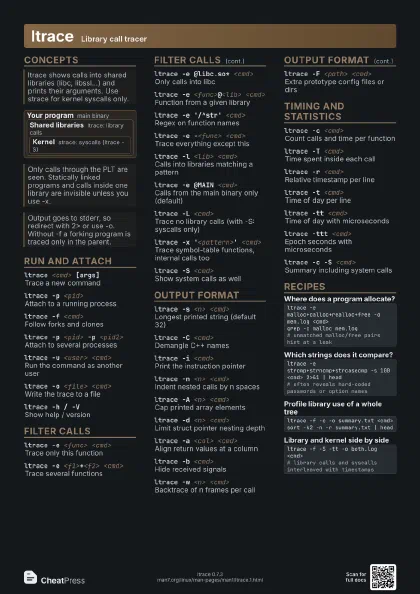
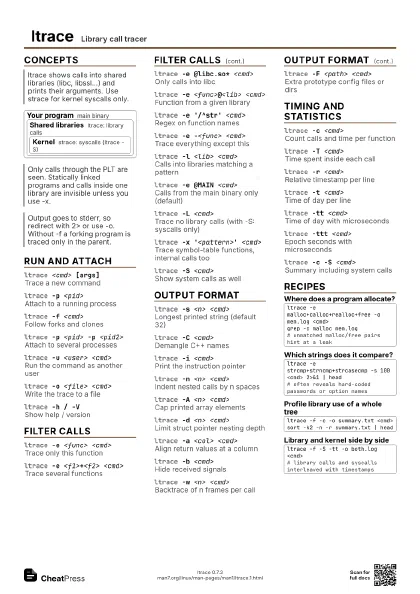
ltrace <cmd>
Trace library calls
ltrace -p <pid>
Attach to a process
ltrace -S <cmd>
Add system calls
ltrace -f <cmd>
Follow child processes
ltrace -c <cmd>
Summary of calls
ltrace -e malloc+free <cmd>
Only these functions
ltrace -o <file> <cmd>
Save trace to file
ltrace -s 200 <cmd>
Longer strings
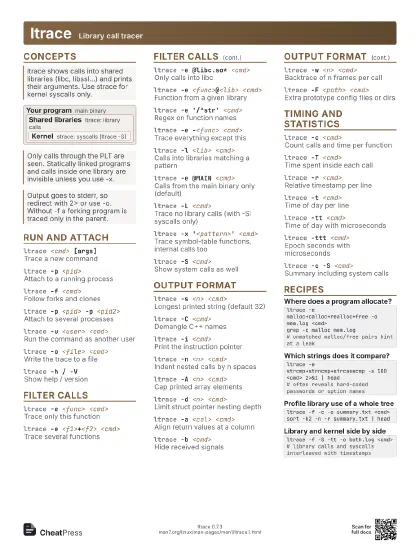
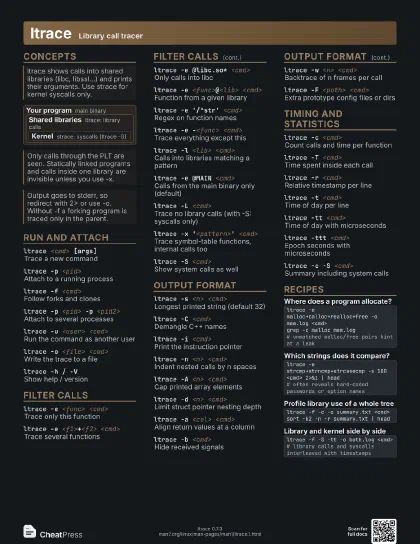
Concepts
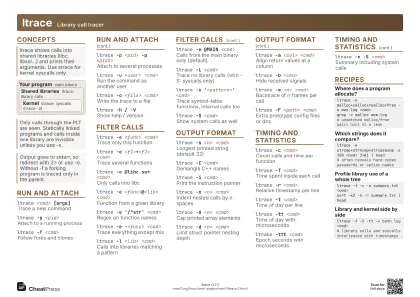
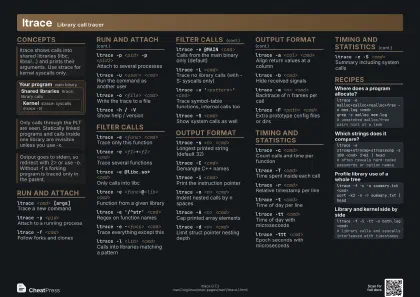
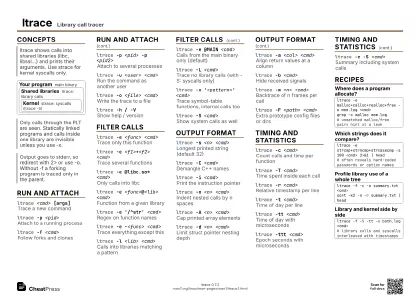
Your program main binary
Shared libraries
ltrace: library calls
Kernel
strace: syscalls (ltrace -S)
Run and attach
ltrace <cmd> [args]
Trace a new command
ltrace -p <pid>
Attach to a running process
Needs the same user or root, and ptrace permission
(kernel.yama.ptrace_scope)
ltrace -f <cmd>
Follow forks and clones
ltrace -p <pid> -p <pid2>
Attach to several processes
ltrace -u <user> <cmd>
Run the command as another user
Only useful when ltrace runs as root
ltrace -o <file> <cmd>
Write the trace to a file
ltrace -h / -VShow help / version
Filter calls
ltrace -e <func> <cmd>
Trace only this function
ltrace -e <f1>+<f2> <cmd>
Trace several functions
ltrace -e @libc.so* <cmd>
Only calls into libc
ltrace -e <func>@<lib> <cmd>
Function from a given library
ltrace -e '/^str' <cmd>
Regex on function names
ltrace -e -<func> <cmd>
Trace everything except this
ltrace -l <lib> <cmd>
Calls into libraries matching a pattern
ltrace -e @MAIN <cmd>
Calls from the main binary only (default)
ltrace -L <cmd>
Trace no library calls (with -S: syscalls only)
ltrace -x '<pattern>' <cmd>
Trace symbol-table functions, internal calls too
No internal calls are traced without -x; -x '*' is
very noisy
ltrace -S <cmd>
Show system calls as well
Output format
ltrace -s <n> <cmd>
Longest printed string (default 32)
ltrace -C <cmd>
Demangle C++ names
ltrace -i <cmd>
Print the instruction pointer
ltrace -n <n> <cmd>
Indent nested calls by n spaces
ltrace -A <n> <cmd>
Cap printed array elements
ltrace -d <n> <cmd>
Limit struct pointer nesting depth
ltrace -a <col> <cmd>
Align return values at a column
ltrace -b <cmd>
Hide received signals
ltrace -w <n> <cmd>
Backtrace of n frames per call
Only works if built with libunwind or elfutils support
ltrace -F <path> <cmd>
Extra prototype config files or dirs
Teach ltrace argument types for a library via a .conf file;
see ltrace.conf(5)
Timing and statistics
ltrace -c <cmd>
Count calls and time per function
ltrace -T <cmd>
Time spent inside each call
ltrace -r <cmd>
Relative timestamp per line
ltrace -t <cmd>
Time of day per line
ltrace -tt <cmd>
Time of day with microseconds
ltrace -ttt <cmd>
Epoch seconds with microseconds
ltrace -c -S <cmd>
Summary including system calls
Recipes
ltrace -e malloc+calloc+realloc+free -o mem.log <cmd>grep -c malloc mem.log# unmatched malloc/free pairs hint at a leakltrace -e strcmp+strncmp+strcasecmp -s 100 <cmd> 2>&1 | head# often reveals hard-coded passwords or option namesltrace -f -c -o summary.txt <cmd>sort -k2 -n -r summary.txt | headltrace -f -S -tt -o both.log <cmd># library calls and syscalls interleaved with timestamps