Cheat
Glances System monitor
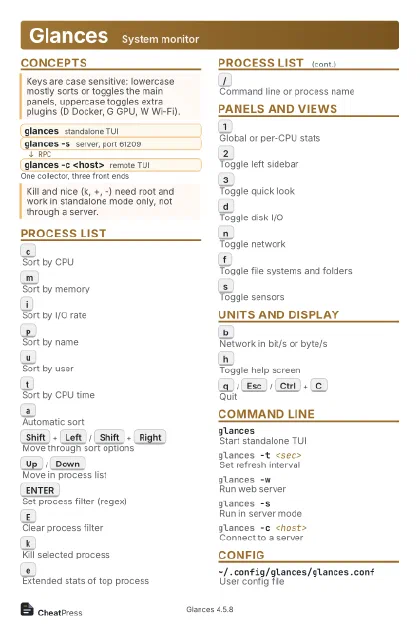 Light · Postcard
102 × 152 mm · PDF
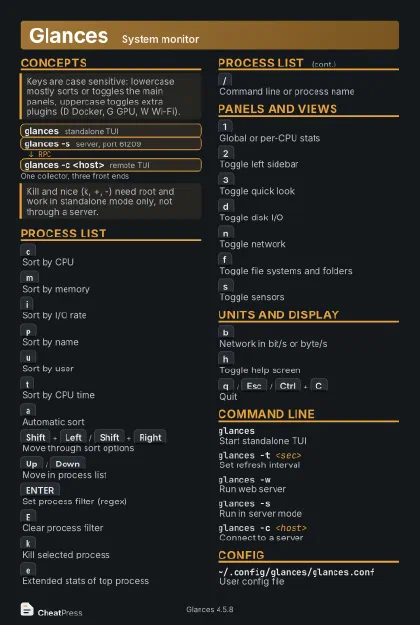 Dark · Postcard
102 × 152 mm · PDF
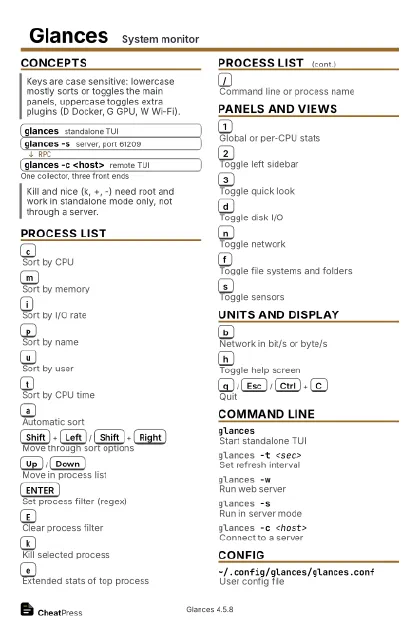 Ink saver · Postcard
102 × 152 mm · PDF
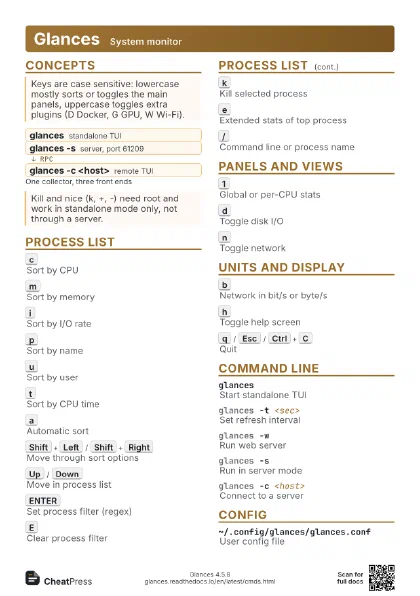
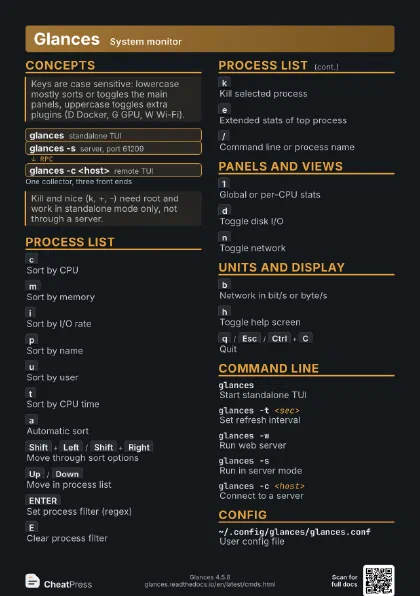
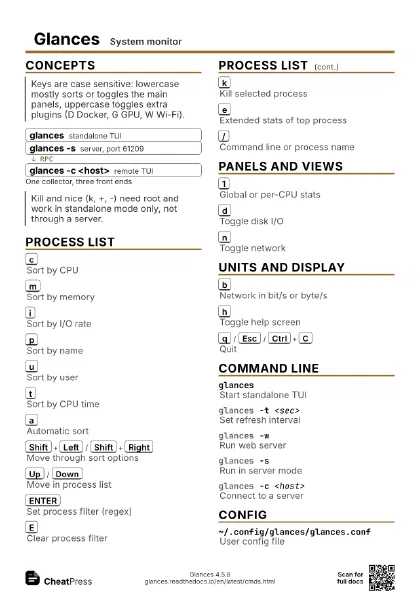
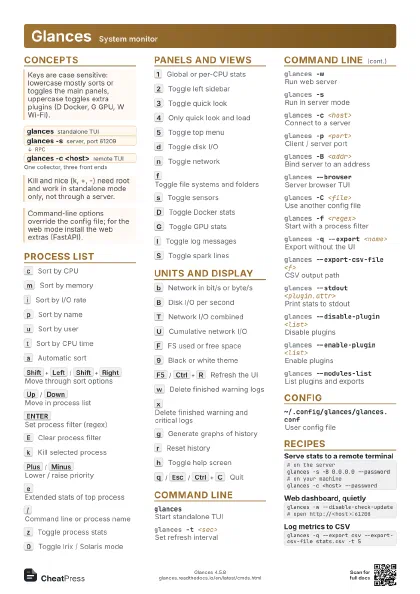
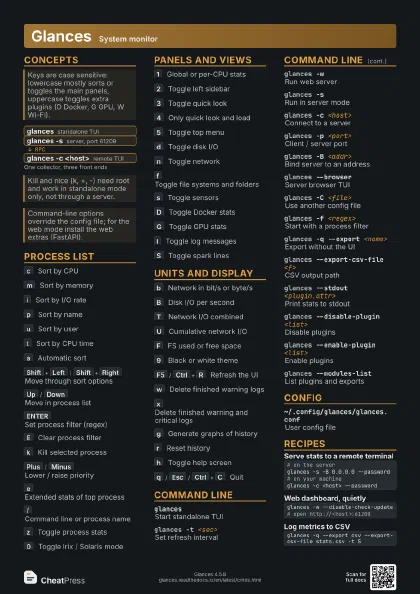
 Light · A4 landscape
297 × 210 mm · PDF
 Dark · A4 landscape
297 × 210 mm · PDF
 Ink saver · A4 landscape
297 × 210 mm · PDF
 Light · A3 landscape
420 × 297 mm · PDF
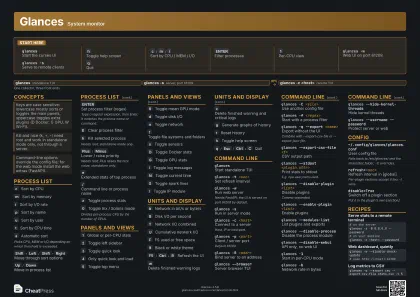 Dark · A3 landscape
420 × 297 mm · PDF
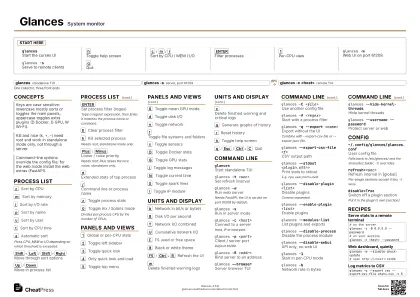 Ink saver · A3 landscape
420 × 297 mm · PDF
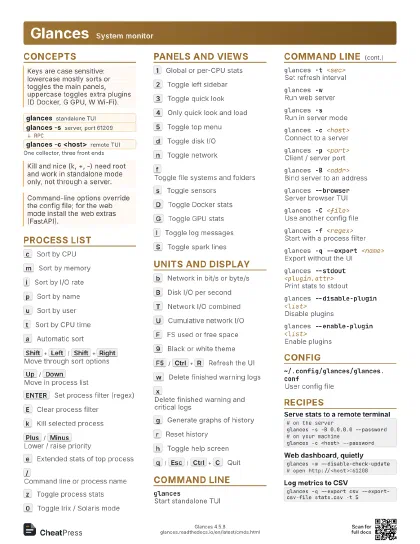
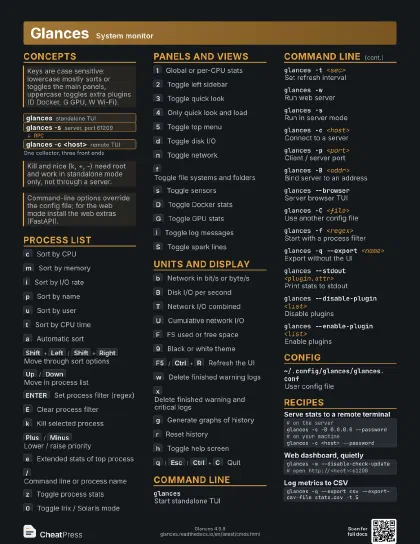
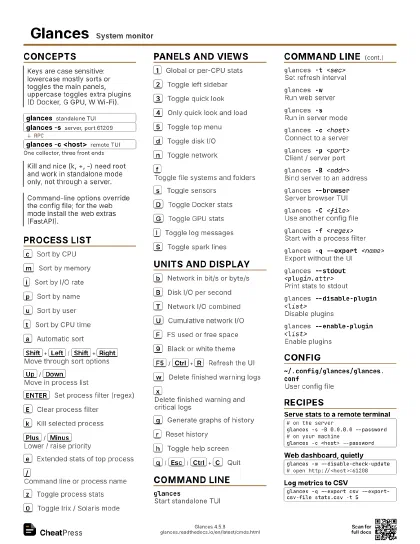
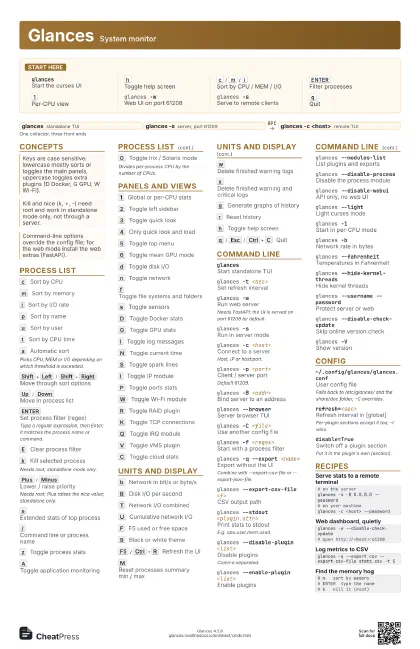
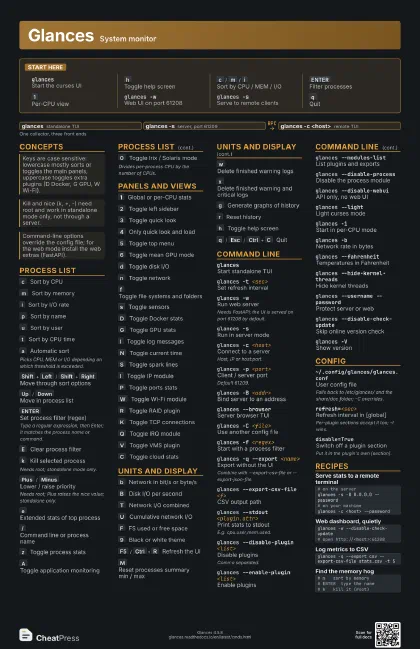
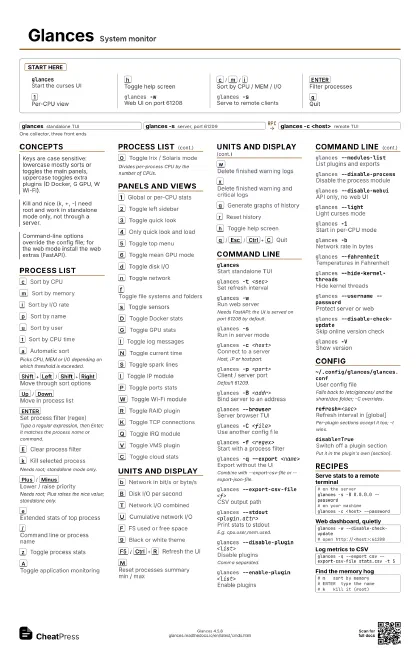
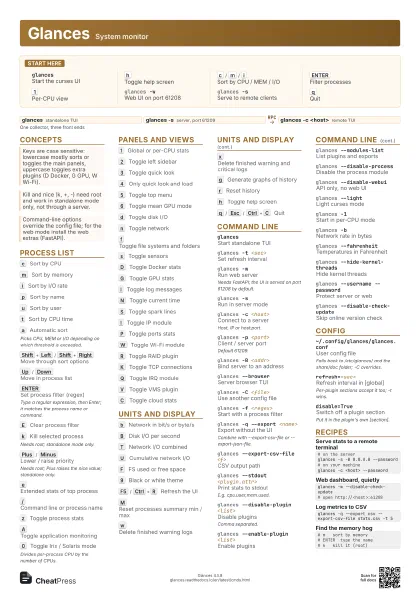
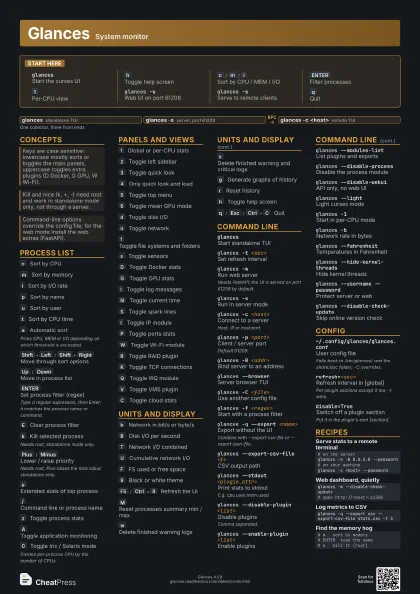
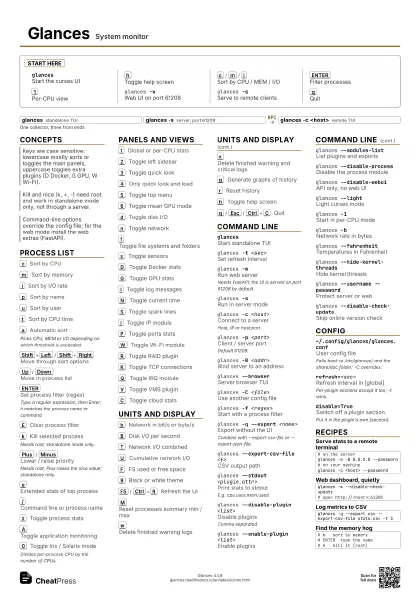
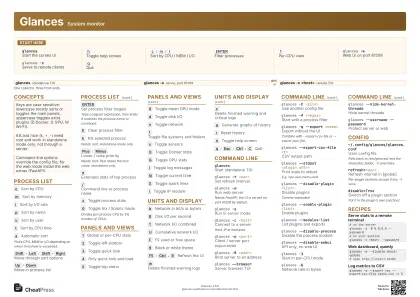
Start here
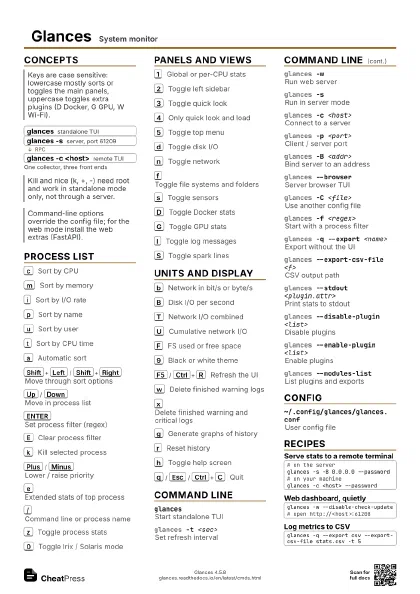
glancesStart the curses UI
h
Toggle help screen
c
/
m
/
i
Sort by CPU / MEM / I/O
ENTER
Filter processes
1
Per-CPU view
glances -wWeb UI on port 61208
glances -sServe to remote clients
q
Quit
Concepts
- glances standalone TUI
- glances -s server, port 61209
- glances -c <host> remote TUI
Process List
c
Sort by CPU
m
Sort by memory
i
Sort by I/O rate
p
Sort by name
u
Sort by user
t
Sort by CPU time
a
Automatic sort
Picks CPU, MEM or I/O depending on which threshold is
exceeded.
Shift+Left
/
Shift+Right
Move through sort options
Up
/
Down
Move in process list
ENTER
Set process filter (regex)
Type a regular expression, then Enter; it matches the process
name or command.
E
Clear process filter
k
Kill selected process
Needs root; standalone mode only.
Plus
/
Minus
Lower / raise priority
Needs root; Plus raises the nice value; standalone only.
e
Extended stats of top process
/
Command line or process name
z
Toggle process stats
A
Toggle application monitoring
0
Toggle Irix / Solaris mode
Divides per-process CPU by the number of CPUs.
Panels and Views
1
Global or per-CPU stats
2
Toggle left sidebar
3
Toggle quick look
4
Only quick look and load
5
Toggle top menu
6
Toggle mean GPU mode
d
Toggle disk I/O
n
Toggle network
f
Toggle file systems and folders
s
Toggle sensors
D
Toggle Docker stats
G
Toggle GPU stats
l
Toggle log messages
N
Toggle current time
S
Toggle spark lines
I
Toggle IP module
P
Toggle ports stats
W
Toggle Wi-Fi module
R
Toggle RAID plugin
K
Toggle TCP connections
Q
Toggle IRQ module
V
Toggle VMS plugin
C
Toggle cloud stats
Units and Display
b
Network in bit/s or byte/s
B
Disk I/O per second
T
Network I/O combined
U
Cumulative network I/O
F
FS used or free space
9
Black or white theme
F5
/
Ctrl+R
Refresh the UI
M
Reset processes summary min / max
w
Delete finished warning logs
x
Delete finished warning and critical logs
g
Generate graphs of history
r
Reset history
h
Toggle help screen
q
/
Esc
/
Ctrl+C
Quit
Command Line
glancesStart standalone TUI
glances -t <sec>
Set refresh interval
glances -wRun web server
Needs FastAPI; the UI is served on port 61208 by default.
glances -sRun in server mode
glances -c <host>
Connect to a server
Host, IP or host:port.
glances -p <port>
Client / server port
Default 61209.
glances -B <addr>
Bind server to an address
glances --browser
Server browser TUI
glances -C <file>
Use another config file
glances -f <regex>
Start with a process filter
glances -q --export <name>
Export without the UI
Combine with --export-csv-file or --export-json-file.
glances --export-csv-file <f>
CSV output path
glances --stdout <plugin.attr>
Print stats to stdout
E.g. cpu.user,mem.used.
glances --disable-plugin <list>
Disable plugins
Comma separated.
glances --enable-plugin <list>
Enable plugins
glances --modules-list
List plugins and exports
glances --disable-process
Disable the process module
glances --disable-webui
API only, no web UI
glances --lightLight curses mode
glances -1Start in per-CPU mode
glances -bNetwork rate in bytes
glances --fahrenheit
Temperatures in Fahrenheit
glances --hide-kernel-threads
Hide kernel threads
glances --username --password
Protect server or web
glances --disable-check-update
Skip online version check
glances -VShow version
Config
~/.config/glances/glances.conf
User config file
Falls back to /etc/glances/ and the share/doc folder; -C
overrides.
refresh=<sec>
Refresh interval in [global]
Per-plugin sections accept it too; -t wins.
disable=TrueSwitch off a plugin section
Put it in the plugin's own [section].
Recipes
# on the serverglances -s -B 0.0.0.0 --password# on your machineglances -c <host> --passwordglances -w --disable-check-update# open http://<host>:61208glances -q --export csv --export-csv-file stats.csv -t 5# m sort by memory# ENTER type the name# k kill it (root)