Cheat
bpftrace Dynamic kernel tracing
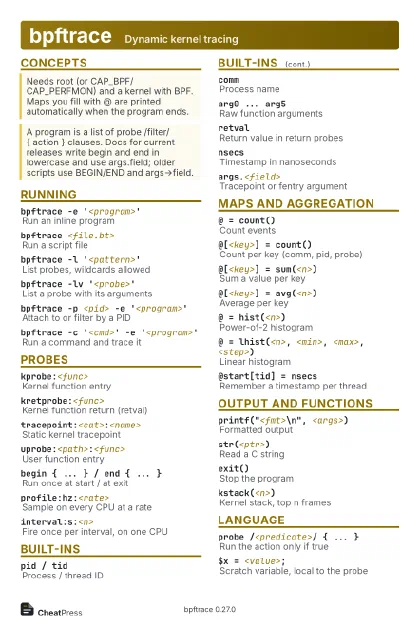 Light · Postcard
102 × 152 mm · PDF
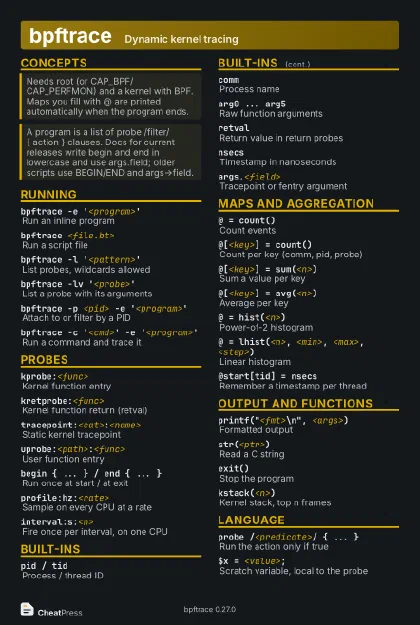 Dark · Postcard
102 × 152 mm · PDF
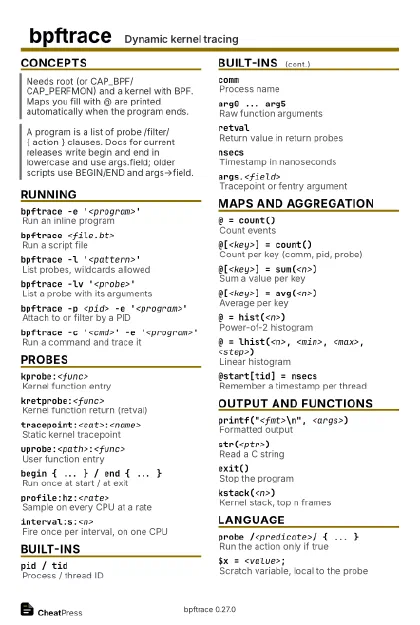 Ink saver · Postcard
102 × 152 mm · PDF
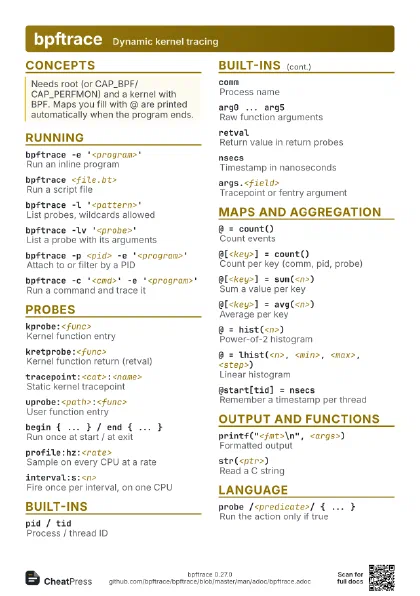
 Light · A4 landscape
297 × 210 mm · PDF
 Dark · A4 landscape
297 × 210 mm · PDF
 Ink saver · A4 landscape
297 × 210 mm · PDF
 Light · A3 landscape
420 × 297 mm · PDF
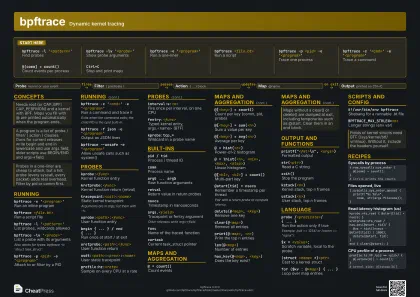 Dark · A3 landscape
420 × 297 mm · PDF
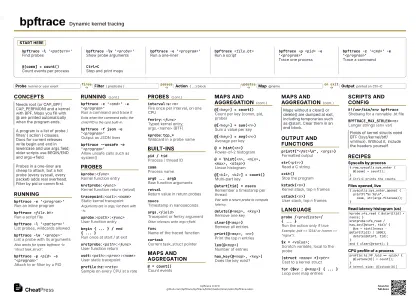 Ink saver · A3 landscape
420 × 297 mm · PDF
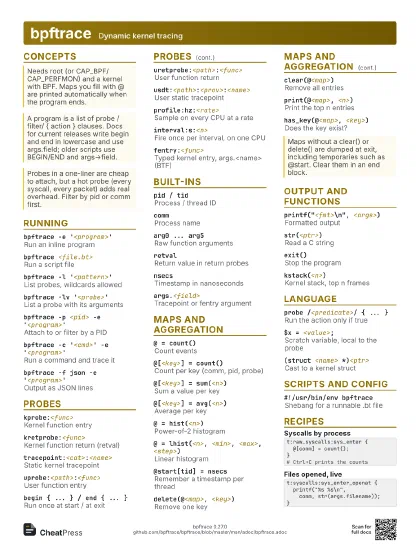
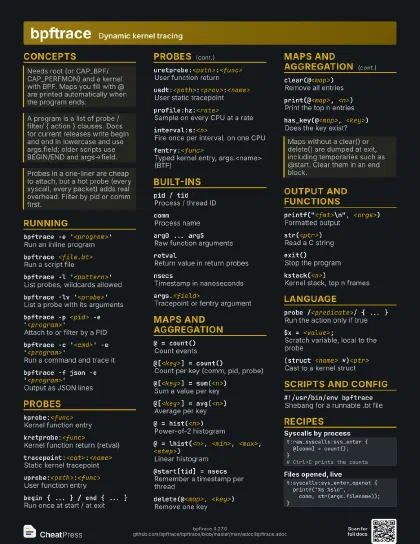
Start here
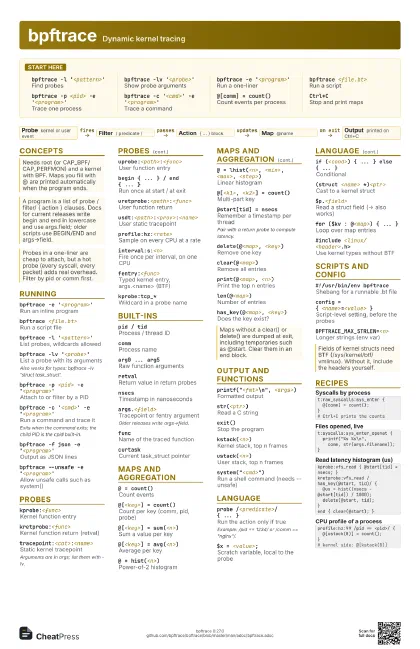
bpftrace -l '<pattern>'
Find probes
bpftrace -lv '<probe>'
Show probe arguments
bpftrace -e '<program>'
Run a one-liner
bpftrace <file.bt>
Run a script
bpftrace -p <pid> -e '<program>'
Trace one process
bpftrace -c '<cmd>' -e
                    '<program>'
Trace a command
@[comm] = count()
Count events per process
Ctrl+CStop and print maps
Concepts
- Probe kernel or user event
- Filter / predicate /
- Action { ... } block
- Map @name
- Output printed on Ctrl+C
Running
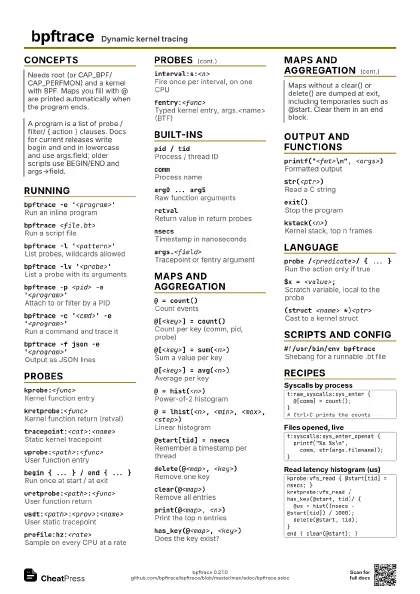
bpftrace -e '<program>'
Run an inline program
bpftrace <file.bt>
Run a script file
bpftrace -l '<pattern>'
List probes, wildcards allowed
bpftrace -lv '<probe>'
List a probe with its arguments
Also works for types: bpftrace -lv 'struct
task_struct'.
bpftrace -p <pid> -e '<program>'
Attach to or filter by a PID
bpftrace -c '<cmd>' -e
                    '<program>'
Run a command and trace it
Exits when the command exits; the child PID is the cpid
built-in.
bpftrace -f json -e '<program>'
Output as JSON lines
bpftrace --unsafe -e '<program>'
Allow unsafe calls such as system()
Probes
kprobe:<func>
Kernel function entry
kretprobe:<func>
Kernel function return (retval)
tracepoint:<cat>:<name>
Static kernel tracepoint
Arguments are in args; list them with -lv.
uprobe:<path>:<func>
User function entry
begin { ... } / end { ... }
Run once at start / at exit
uretprobe:<path>:<func>
User function return
usdt:<path>:<prov>:<name>
User static tracepoint
profile:hz:<rate>
Sample on every CPU at a rate
interval:s:<n>
Fire once per interval, on one CPU
fentry:<func>
Typed kernel entry, args.<name> (BTF)
kprobe:tcp_*Wildcard in a probe name
Built-ins
pid / tidProcess / thread ID
commProcess name
arg0 ... arg5Raw function arguments
retvalReturn value in return probes
nsecsTimestamp in nanoseconds
args.<field>
Tracepoint or fentry argument
Older releases write args->field.
funcName of the traced function
curtaskCurrent task_struct pointer
Maps and aggregation
@ = count()Count events
@[<key>] = count()
Count per key (comm, pid, probe)
@[<key>] = sum(<n>)
Sum a value per key
@[<key>] = avg(<n>)
Average per key
@ = hist(<n>)
Power-of-2 histogram
@ = lhist(<n>, <min>, <max>,
                    <step>)
Linear histogram
@[<k1>, <k2>] = count()
Multi-part key
@start[tid] = nsecs
Remember a timestamp per thread
Pair with a return probe to compute latency.
delete(@<map>, <key>)
Remove one key
clear(@<map>)
Remove all entries
print(@<map>, <n>)
Print the top n entries
len(@<map>)
Number of entries
has_key(@<map>, <key>)
Does the key exist?
Output and functions
printf("<fmt>\n", <args>)
Formatted output
str(<ptr>)
Read a C string
exit()Stop the program
kstack(<n>)
Kernel stack, top n frames
ustack(<n>)
User stack, top n frames
system("<cmd>")
Run a shell command (needs --unsafe)
Language
probe /<predicate>/ { ... }
Run the action only if true
Example: /pid == 1234/ or /comm == "nginx"/.
$x = <value>;
Scratch variable, local to the probe
if (<cond>) { ... } else { ... }
Conditional
(struct <name> *)<ptr>
Cast to a kernel struct
$p.<field>
Read a struct field (-> also works)
for ($kv : @<map>) { ... }
Loop over map entries
#include <linux/<header>.h>
Use kernel types without BTF
Scripts and config
#!/usr/bin/env bpftrace
Shebang for a runnable .bt file
config = { <name>=<value> }
Script-level setting, before the probes
BPFTRACE_MAX_STRLEN=<n>
Longer strings (env var)
Recipes
t:raw_syscalls:sys_enter { @[comm] = count();}# Ctrl+C prints the countst:syscalls:sys_enter_openat { printf("%s %s\n", comm, str(args.filename));}kprobe:vfs_read { @start[tid] = nsecs; }kretprobe:vfs_read /has_key(@start, tid)/ { @us = hist((nsecs - @start[tid]) / 1000); delete(@start, tid);}end { clear(@start); }profile:hz:99 /pid == <pid>/ { @[ustack(8)] = count();}# kernel side: @[kstack(8)]