Cheat
R Statistical computing
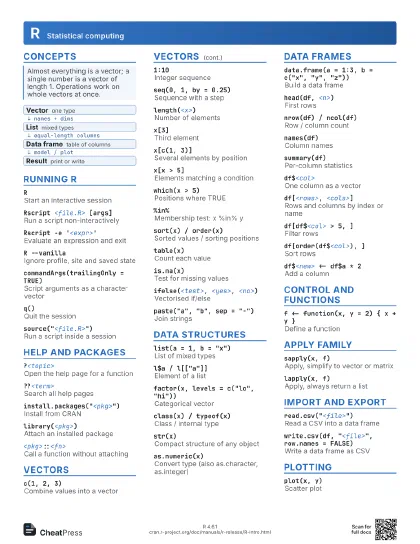
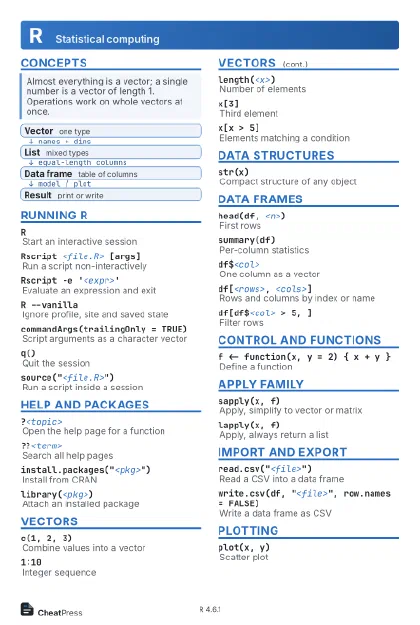 Light · Postcard
102 × 152 mm · PDF
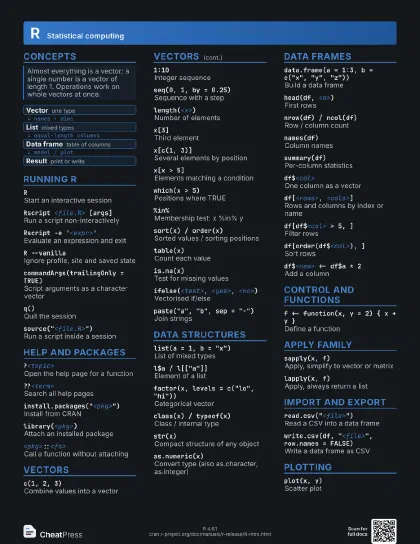
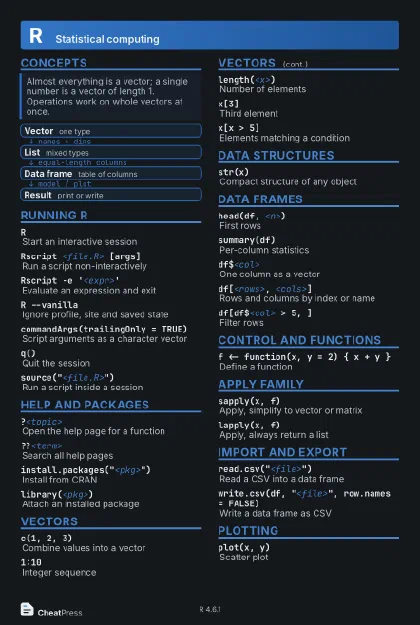 Dark · Postcard
102 × 152 mm · PDF
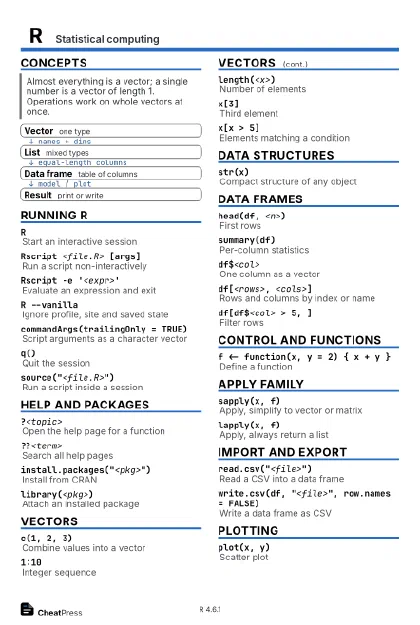 Ink saver · Postcard
102 × 152 mm · PDF
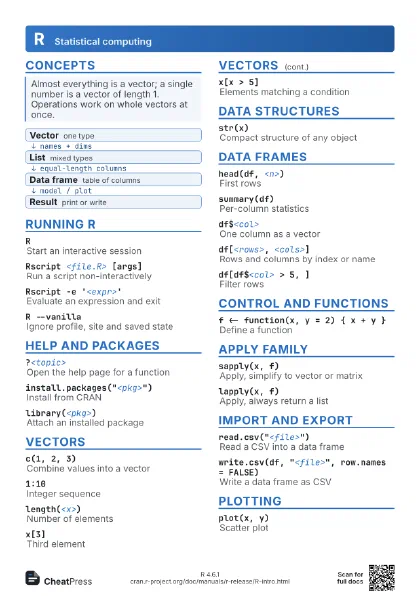
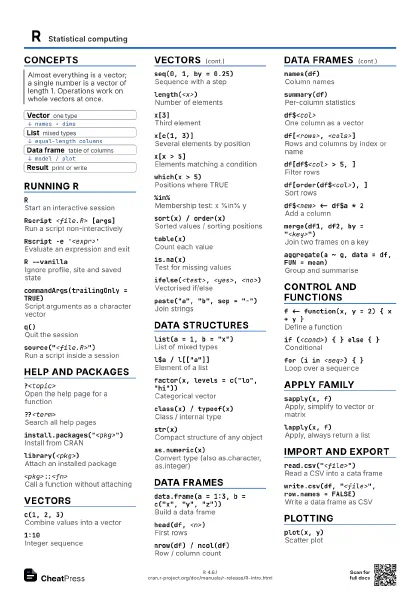
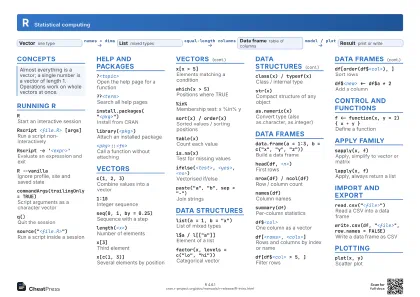 Light · A4 landscape
297 × 210 mm · PDF
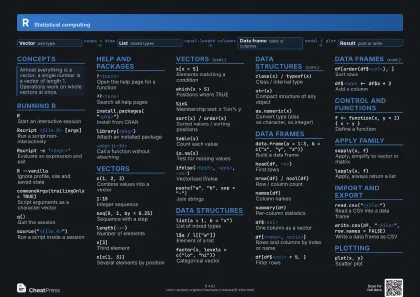 Dark · A4 landscape
297 × 210 mm · PDF
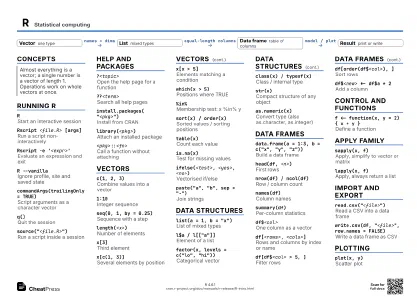 Ink saver · A4 landscape
297 × 210 mm · PDF
 Light · A3 landscape
420 × 297 mm · PDF
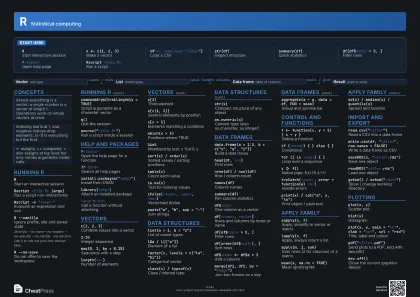 Dark · A3 landscape
420 × 297 mm · PDF
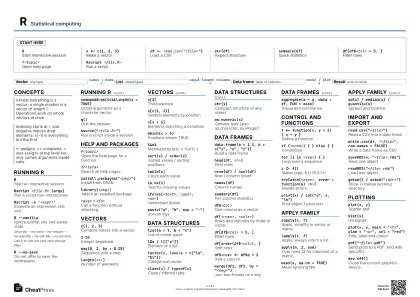 Ink saver · A3 landscape
420 × 297 mm · PDF
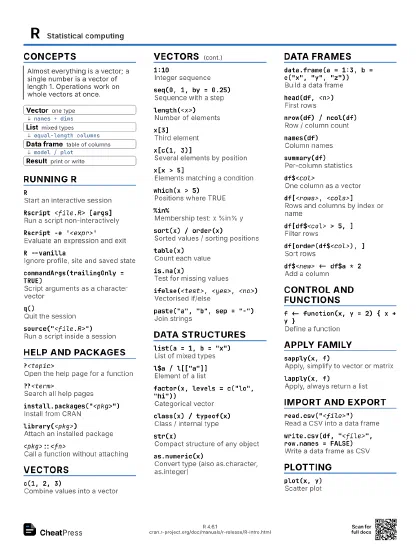
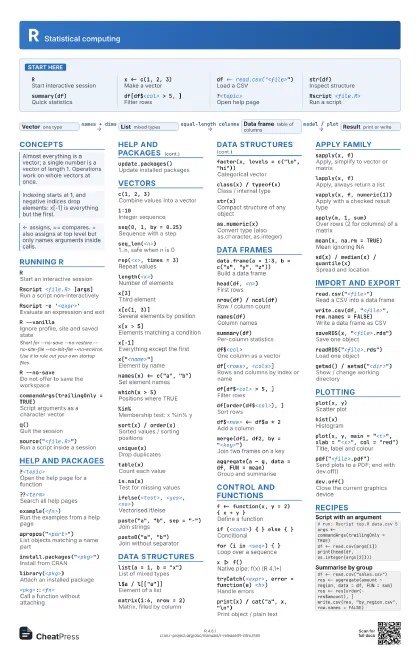
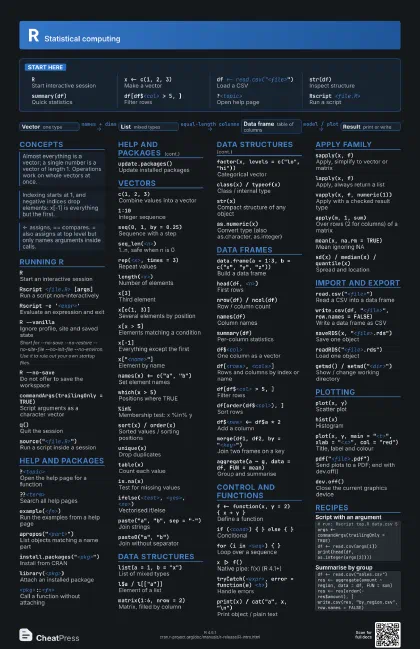
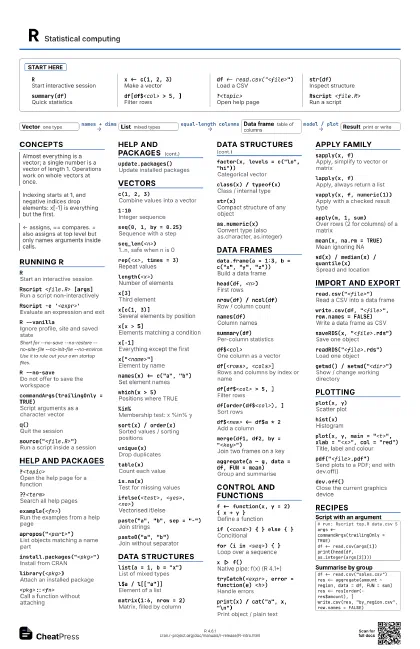
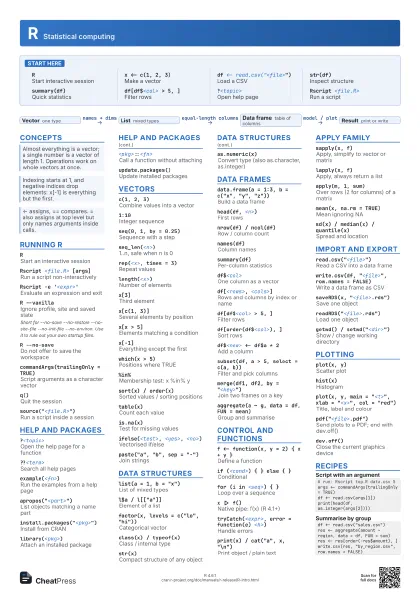
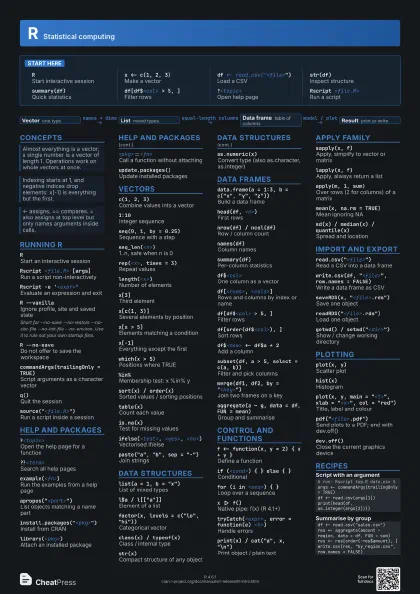
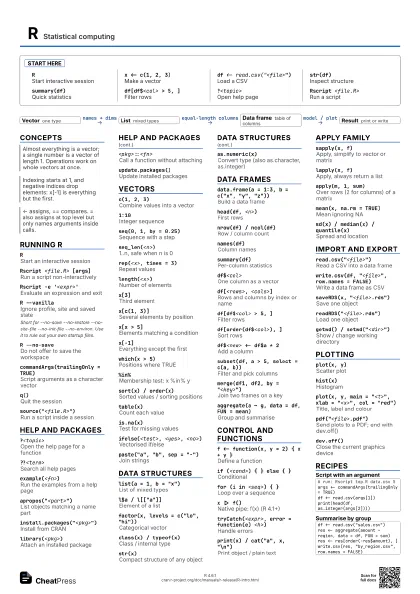
Start here
RStart interactive session
x <- c(1, 2, 3)
Make a vector
df <- read.csv("<file>")
Load a CSV
str(df)Inspect structure
summary(df)Quick statistics
df[df$<col> > 5, ]
Filter rows
?<topic>Open help page
Rscript <file.R>
Run a script
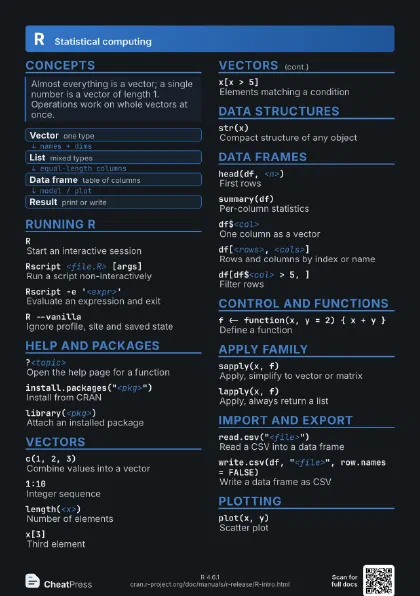
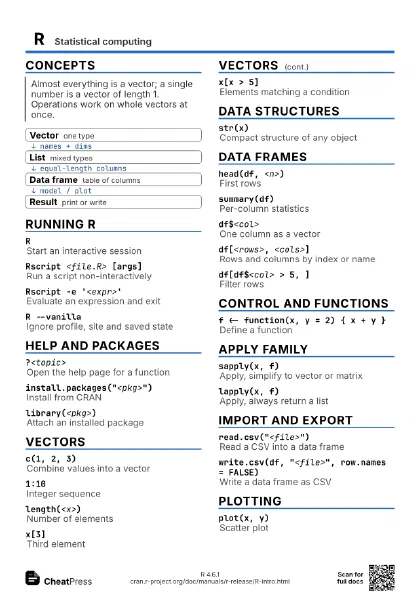
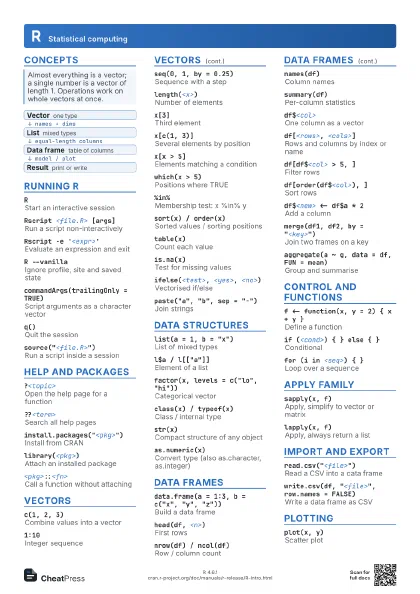
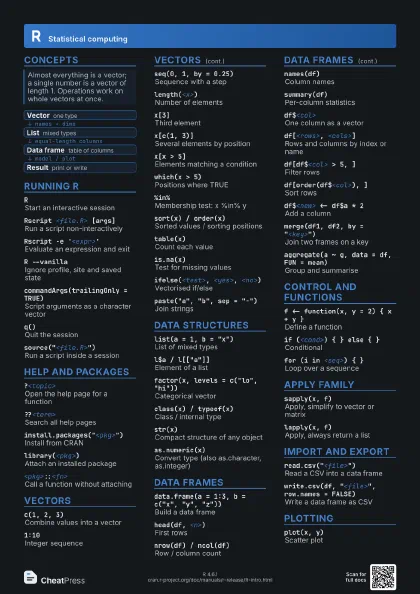
Concepts
- Vector one type
- List mixed types
- Data frame table of columns
- Result print or write
Running R
RStart an interactive session
Rscript <file.R> [args]
Run a script non-interactively
Rscript -e '<expr>'
Evaluate an expression and exit
R --vanillaIgnore profile, site and saved state
Short for --no-save --no-restore --no-site-file --no-init-file
--no-environ. Use it to rule out your own startup files.
R --no-saveDo not offer to save the workspace
commandArgs(trailingOnly = TRUE)
Script arguments as a character vector
q()Quit the session
source("<file.R>")
Run a script inside a session
Help and packages
?<topic>Open the help page for a function
??<term>Search all help pages
example(<fn>)
Run the examples from a help page
apropos("<part>")
List objects matching a name part
install.packages("<pkg>")
Install from CRAN
library(<pkg>)
Attach an installed package
<pkg>::<fn>
Call a function without attaching
update.packages()
Update installed packages
Vectors
c(1, 2, 3)Combine values into a vector
1:10Integer sequence
seq(0, 1, by = 0.25)
Sequence with a step
seq_len(<n>)
1..n, safe when n is 0
rep(<x>, times = 3)
Repeat values
length(<x>)
Number of elements
x[3]Third element
x[c(1, 3)]Several elements by position
x[x > 5]Elements matching a condition
x[-1]Everything except the first
x["<name>"]
Element by name
names(x) <- c("a", "b")
Set element names
which(x > 5)Positions where TRUE
%in%Membership test: x %in% y
sort(x) / order(x)
Sorted values / sorting positions
unique(x)Drop duplicates
table(x)Count each value
is.na(x)Test for missing values
ifelse(<test>, <yes>, <no>)
Vectorised if/else
paste("a", "b", sep = "-")
Join strings
paste0("a", "b")
Join without separator
Data structures
list(a = 1, b = "x")
List of mixed types
l$a / l[["a"]]
Element of a list
matrix(1:6, nrow = 2)
Matrix, filled by column
m[1, 2] / m[1, ]
Cell / whole row
factor(x, levels = c("lo", "hi"))
Categorical vector
levels(f)Categories of a factor
class(x) / typeof(x)
Class / internal type
str(x)Compact structure of any object
as.numeric(x)
Convert type (also as.character, as.integer)
as.Date("2026-10-14")
Parse an ISO date
Data frames
data.frame(a = 1:3, b = c("x", "y",
                    "z"))
Build a data frame
head(df, <n>)
First rows
tail(df, <n>)
Last rows
nrow(df) / ncol(df)
Row / column count
names(df)Column names
summary(df)Per-column statistics
df$<col>One column as a vector
df[<rows>, <cols>]
Rows and columns by index or name
df[df$<col> > 5, ]
Filter rows
df[order(df$<col>), ]
Sort rows
df$<new> <- df$a * 2
Add a column
subset(df, a > 5, select = c(a, b))
Filter and pick columns
rbind(df1, df2)Stack rows
merge(df1, df2, by = "<key>")
Join two frames on a key
aggregate(a ~ g, data = df, FUN = mean)
Group and summarise
complete.cases(df)
Rows with no NA
na.omit(df)Drop rows with NA
Control and functions
f <- function(x, y = 2) { x + y }
Define a function
return(<value>)
Return early; otherwise the last value
if (<cond>) { } else { }
Conditional
for (i in <seq>) { }
Loop over a sequence
function(x) x^2Anonymous function
\(x) x^2Short lambda form (R 4.1+)
x |> f()Native pipe: f(x) (R 4.1+)
stop("<msg>") /
                    warning("<msg>")
Raise error / warning
tryCatch(<expr>, error = function(e) <h>)
Handle errors
print(x) / cat("a", x, "\n")
Print object / plain text
Apply family
sapply(x, f)Apply, simplify to vector or matrix
lapply(x, f)Apply, always return a list
vapply(x, f, numeric(1))
Apply with a checked result type
apply(m, 1, sum)
Over rows (2 for columns) of a matrix
tapply(x, g, mean)
Apply per group
do.call(rbind, <list>)
Call a function with a list as arguments
rowSums(m) / colMeans(m)
Fast row and column sums or means
mean(x, na.rm = TRUE)
Mean ignoring NA
sd(x) / median(x) / quantile(x)
Spread and location
cor(x, y)Correlation
round(x, 2)Round to 2 decimals
Import and export
read.csv("<file>")
Read a CSV into a data frame
write.csv(df, "<file>", row.names =
                    FALSE)
Write a data frame as CSV
read.table("<file>", header = TRUE)
Read delimited text
readLines("<file>")
Read lines of text
writeLines(x, "<file>")
Write lines of text
saveRDS(x, "<file>.rds")
Save one object
readRDS("<file>.rds")
Load one object
getwd() / setwd("<dir>")
Show / change working directory
list.files("<dir>")
List files in a directory
Plotting
plot(x, y)Scatter plot
hist(x)Histogram
boxplot(<y> ~ <g>, data = df)
Box plot by group
barplot(table(x))
Bar chart of counts
lines(x, y) / points(x, y)
Add to an existing plot
plot(x, y, main = "<t>", xlab =
                    "<x>", col = "red")
Title, label and colour
par(mfrow = c(1, 2))
Two plots side by side
pdf("<file>.pdf")
Send plots to a PDF; end with dev.off()
png("<file>.png")
Send plots to a PNG; end with dev.off()
dev.off()Close the current graphics device
Recipes
# run: Rscript top.R data.csv 5args <- commandArgs(trailingOnly = TRUE)df <- read.csv(args[1])print(head(df, as.integer(args[2])))df <- read.csv("sales.csv")res <- aggregate(amount ~ region, data = df, FUN = sum)res <- res[order(-res$amount), ]write.csv(res, "by_region.csv", row.names = FALSE)png("hist.png", width = 800, height = 600)hist(df$amount, main = "Amounts", xlab = "EUR")dev.off()Rscript -e 'x <- read.csv("data.csv"); print(summary(x))'