Cheat
Matplotlib Python plotting
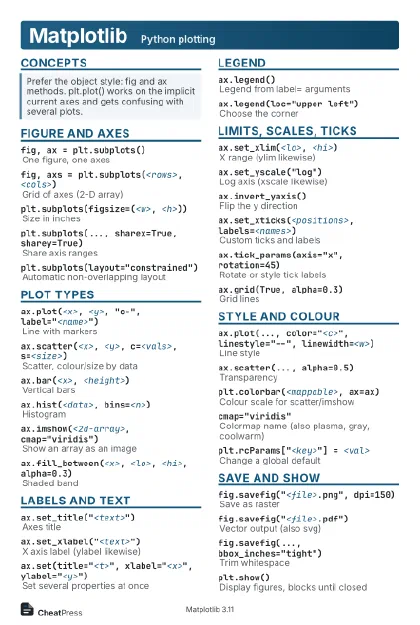 Light · Postcard
102 × 152 mm · PDF
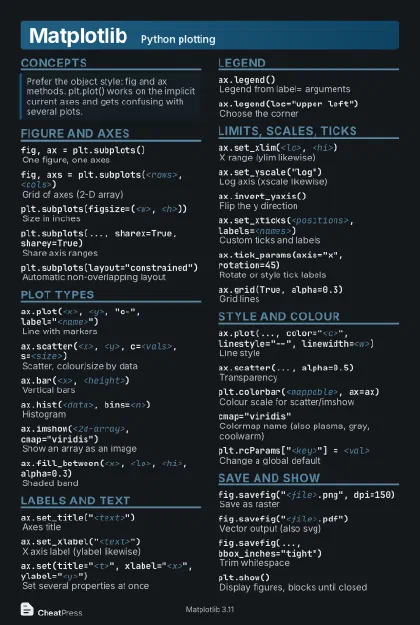 Dark · Postcard
102 × 152 mm · PDF
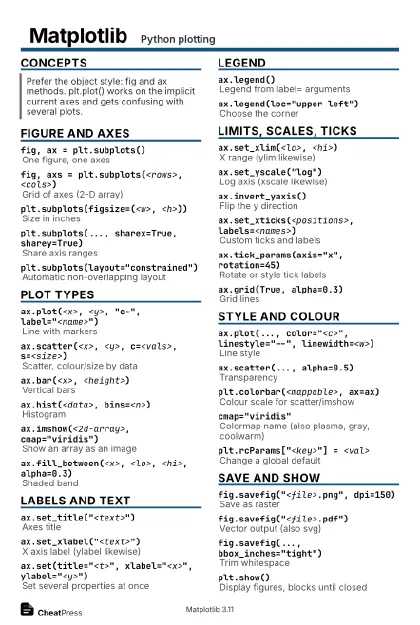 Ink saver · Postcard
102 × 152 mm · PDF
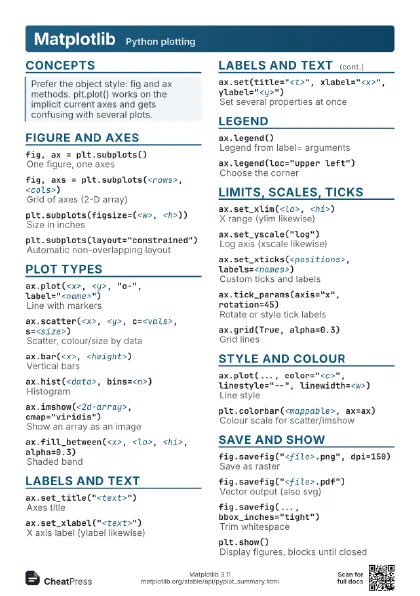
 Light · A4 landscape
297 × 210 mm · PDF
 Dark · A4 landscape
297 × 210 mm · PDF
 Ink saver · A4 landscape
297 × 210 mm · PDF
 Light · A3 landscape
420 × 297 mm · PDF
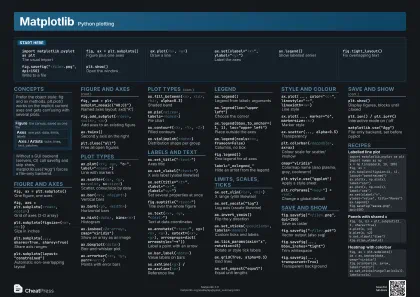 Dark · A3 landscape
420 × 297 mm · PDF
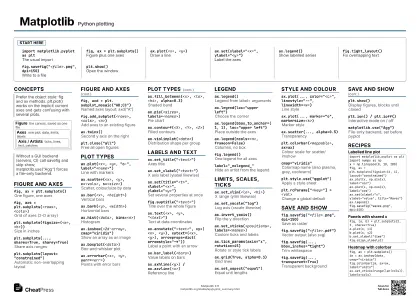 Ink saver · A3 landscape
420 × 297 mm · PDF
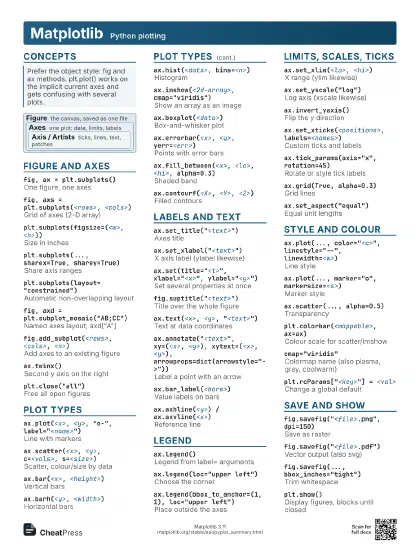
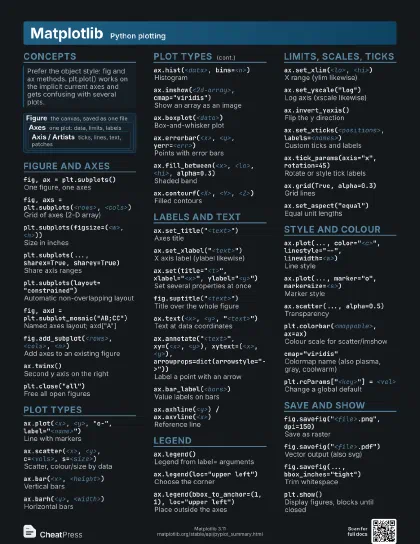
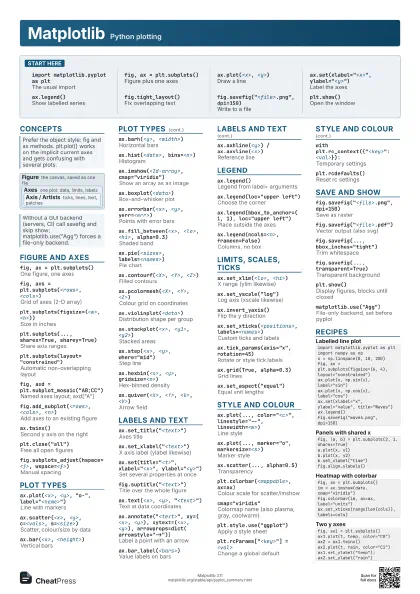
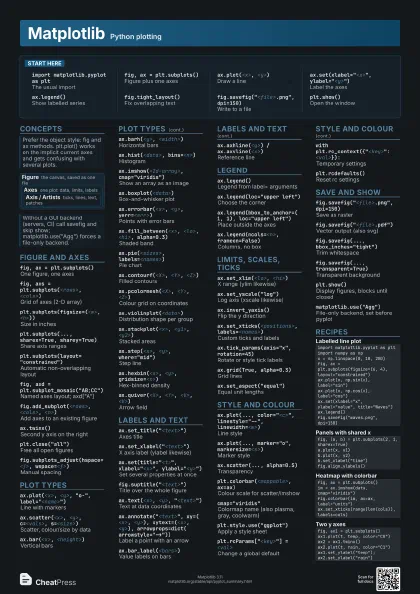
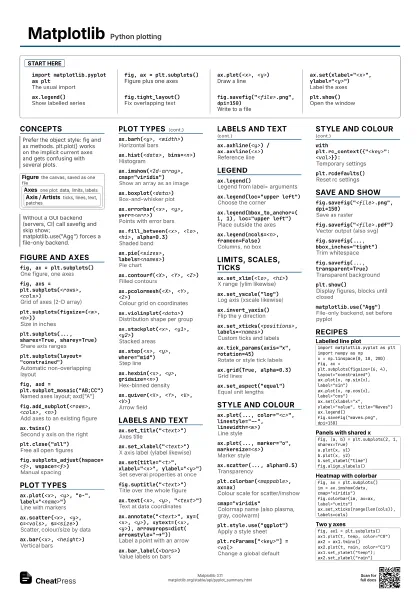
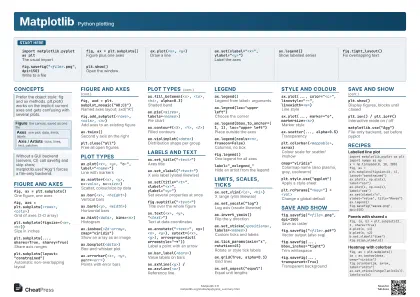
Start here
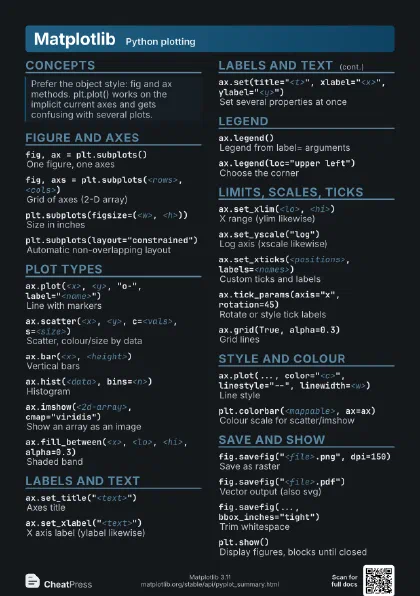
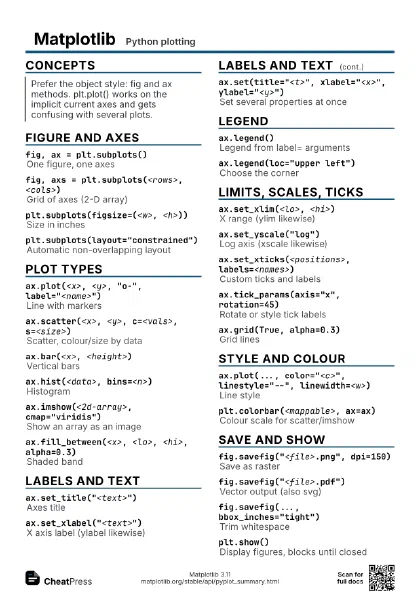
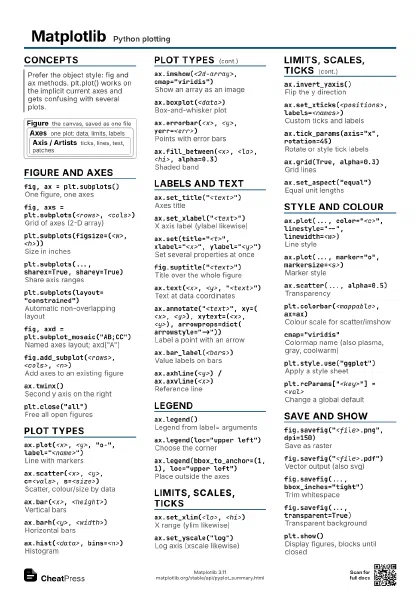
import matplotlib.pyplot as plt
The usual import
fig, ax = plt.subplots()
Figure plus one axes
ax.plot(<x>, <y>)
Draw a line
ax.set(xlabel="<x>",
                    ylabel="<y>")
Label the axes
ax.legend()Show labelled series
fig.tight_layout()
Fix overlapping text
fig.savefig("<file>.png", dpi=150)
Write to a file
plt.show()Open the window
Concepts
Figure
the canvas, saved as one file
Axes
one plot: data, limits, labels
Axis / Artists
ticks, lines, text, patches
Figure and axes
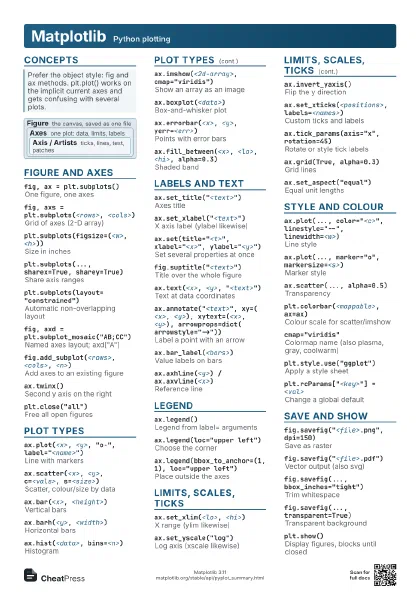
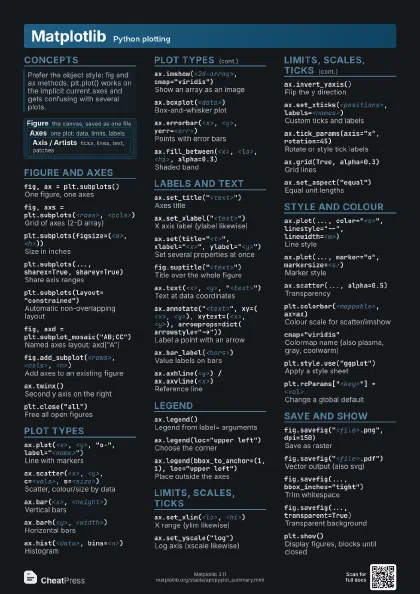
fig, ax = plt.subplots()
One figure, one axes
fig, axs = plt.subplots(<rows>, <cols>)
Grid of axes (2-D array)
plt.subplots(figsize=(<w>, <h>))
Size in inches
plt.subplots(..., sharex=True, sharey=True)
Share axis ranges
plt.subplots(layout="constrained")
Automatic non-overlapping layout
fig, axd = plt.subplot_mosaic("AB;CC")
Named axes layout; axd["A"]
fig.add_subplot(<rows>, <cols>,
                    <n>)
Add axes to an existing figure
ax.twinx()Second y axis on the right
plt.close("all")
Free all open figures
fig.subplots_adjust(hspace=<f>,
                    wspace=<f>)
Manual spacing
Plot types
ax.plot(<x>, <y>, "o-",
                    label="<name>")
Line with markers
ax.scatter(<x>, <y>, c=<vals>,
                    s=<size>)
Scatter, colour/size by data
ax.bar(<x>, <height>)
Vertical bars
ax.barh(<y>, <width>)
Horizontal bars
ax.hist(<data>, bins=<n>)
Histogram
ax.imshow(<2d-array>, cmap="viridis")
Show an array as an image
ax.boxplot(<data>)
Box-and-whisker plot
ax.errorbar(<x>, <y>, yerr=<err>)
Points with error bars
ax.fill_between(<x>, <lo>, <hi>,
                    alpha=0.3)
Shaded band
ax.pie(<sizes>, labels=<names>)
Pie chart
ax.contourf(<X>, <Y>, <Z>)
Filled contours
ax.pcolormesh(<X>, <Y>, <Z>)
Colour grid on coordinates
ax.violinplot(<data>)
Distribution shape per group
ax.stackplot(<x>, <y1>, <y2>)
Stacked areas
ax.step(<x>, <y>, where="mid")
Step line
ax.hexbin(<x>, <y>, gridsize=<n>)
Hex-binned density
ax.quiver(<X>, <Y>, <U>, <V>)
Arrow field
Labels and text
ax.set_title("<text>")
Axes title
ax.set_xlabel("<text>")
X axis label (ylabel likewise)
ax.set(title="<t>",
                    xlabel="<x>",
                    ylabel="<y>")
Set several properties at once
fig.suptitle("<text>")
Title over the whole figure
ax.text(<x>, <y>, "<text>")
Text at data coordinates
ax.annotate("<text>", xy=(<x>,
                    <y>), xytext=(<x>, <y>),
                    arrowprops=dict(arrowstyle="->"))
Label a point with an arrow
ax.bar_label(<bars>)
Value labels on bars
ax.axhline(<y>) / ax.axvline(<x>)
Reference line
ax.axvspan(<x1>, <x2>, alpha=0.2)
Shade a range
Legend
ax.legend()Legend from label= arguments
ax.legend(loc="upper left")
Choose the corner
ax.legend(bbox_to_anchor=(1, 1), loc="upper
                    left")
Place outside the axes
ax.legend(ncols=<n>, frameon=False)
Columns, no box
fig.legend()One legend for all axes
label="_nolegend_"
Hide an artist from the legend
Limits, scales, ticks
ax.set_xlim(<lo>, <hi>)
X range (ylim likewise)
ax.set_yscale("log")
Log axis (xscale likewise)
ax.invert_yaxis()
Flip the y direction
ax.set_xticks(<positions>,
                    labels=<names>)
Custom ticks and labels
ax.tick_params(axis="x", rotation=45)
Rotate or style tick labels
ax.grid(True, alpha=0.3)
Grid lines
ax.set_aspect("equal")
Equal unit lengths
ax.margins(<f>)
Padding around the data
ax.xaxis.set_major_formatter(<fmt>)
Custom tick text (matplotlib.ticker)
ax.axis("off")
Hide axes completely
Style and colour
ax.plot(..., color="<c>",
                    linestyle="--", linewidth=<w>)
Line style
ax.plot(..., marker="o",
                    markersize=<s>)
Marker style
ax.scatter(..., alpha=0.5)
Transparency
plt.colorbar(<mappable>, ax=ax)
Colour scale for scatter/imshow
cmap="viridis"
Colormap name (also plasma, gray, coolwarm)
vmin=<a>, vmax=<b>
Fix the colour range
plt.style.use("ggplot")
Apply a style sheet
plt.style.available
List style sheets
plt.rcParams["<key>"] = <val>
Change a global default
with plt.rc_context({"<key>":
                    <val>}):
Temporary settings
plt.rcdefaults()
Reset rc settings
Save and show
fig.savefig("<file>.png", dpi=150)
Save as raster
fig.savefig("<file>.pdf")
Vector output (also svg)
fig.savefig(..., bbox_inches="tight")
Trim whitespace
fig.savefig(..., transparent=True)
Transparent background
plt.show()Display figures, blocks until closed
plt.ion() / plt.ioff()
Interactive mode on / off
fig.canvas.draw_idle()
Request a redraw
plt.imread("<file>")
Load an image as array
matplotlib.use("Agg")
File-only backend, set before pyplot
Recipes
import matplotlib.pyplot as pltimport numpy as npx = np.linspace(0, 10, 200)fig, ax = plt.subplots(figsize=(6, 4), layout="constrained")ax.plot(x, np.sin(x), label="sin")ax.plot(x, np.cos(x), label="cos")ax.set(xlabel="x", ylabel="value", title="Waves")ax.legend()fig.savefig("waves.png", dpi=150)fig, (a, b) = plt.subplots(2, 1, sharex=True)a.plot(x, y1)b.plot(x, y2)b.set_xlabel("time")fig.align_ylabels()fig, ax = plt.subplots()im = ax.imshow(data, cmap="viridis")fig.colorbar(im, ax=ax, label="units")ax.set_xticks(range(len(cols)), labels=cols)fig, ax1 = plt.subplots()ax1.plot(t, temp, color="C0")ax2 = ax1.twinx()ax2.plot(t, rain, color="C1")ax1.set_ylabel("temp"); ax2.set_ylabel("rain")