Cheat
Lighthouse Web page quality audits
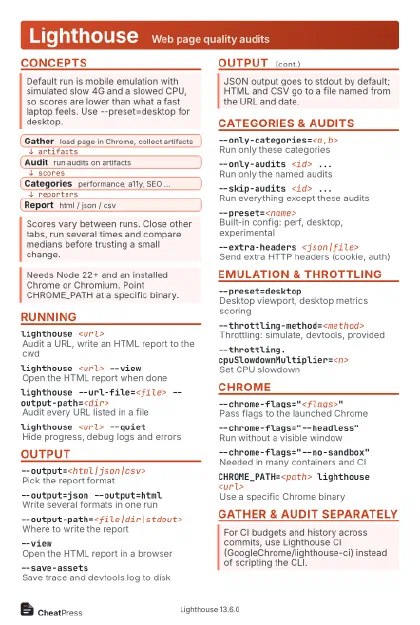 Light · Postcard
102 × 152 mm · PDF
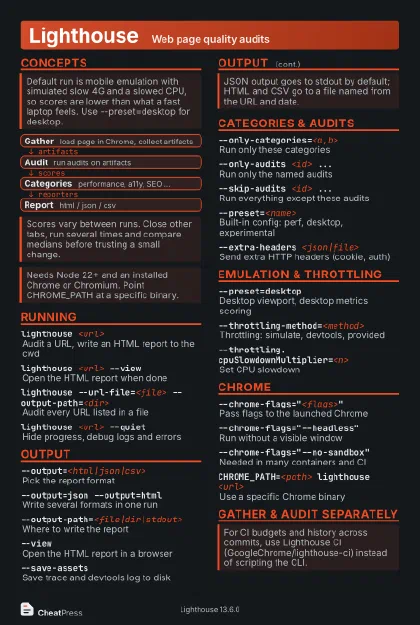 Dark · Postcard
102 × 152 mm · PDF
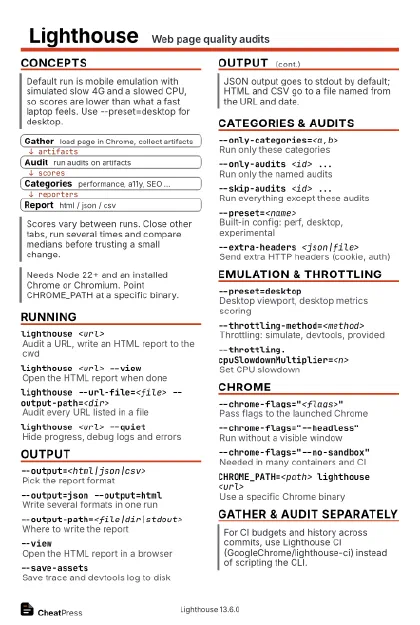 Ink saver · Postcard
102 × 152 mm · PDF
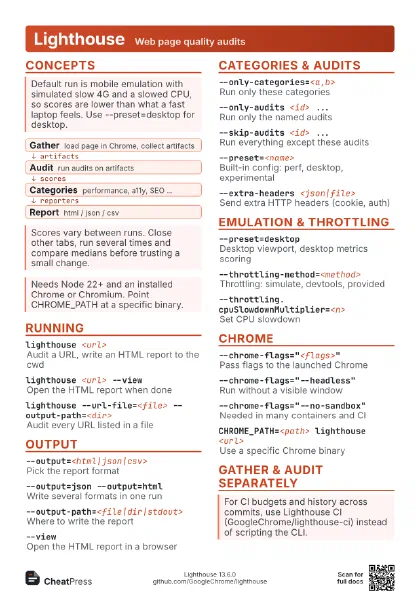
 Light · A4 landscape
297 × 210 mm · PDF
 Dark · A4 landscape
297 × 210 mm · PDF
 Ink saver · A4 landscape
297 × 210 mm · PDF
 Light · A3 landscape
420 × 297 mm · PDF
 Dark · A3 landscape
420 × 297 mm · PDF
 Ink saver · A3 landscape
420 × 297 mm · PDF
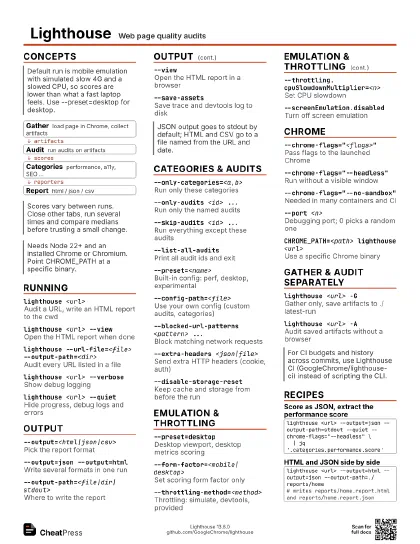
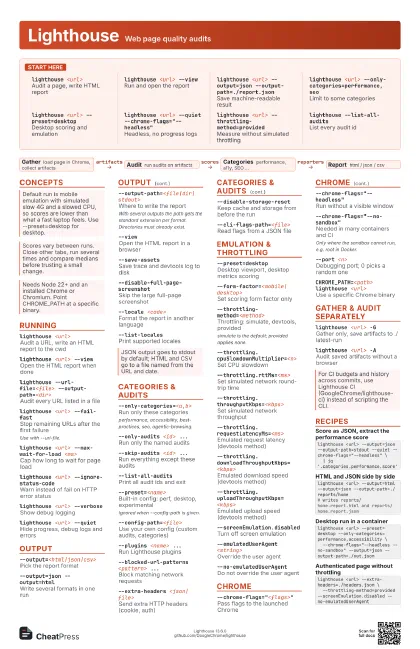
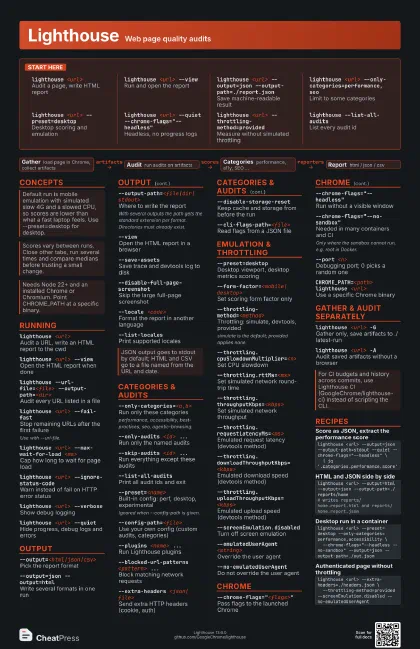
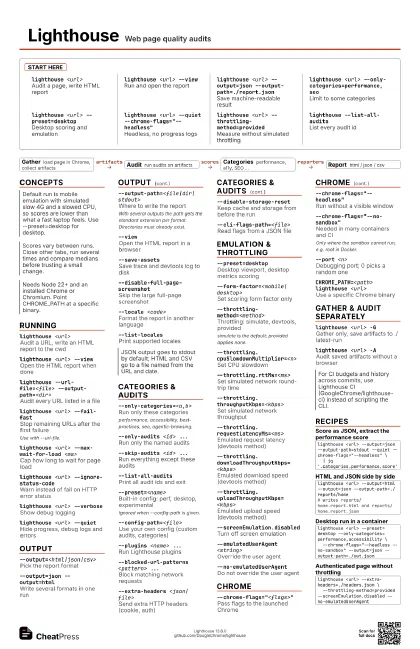
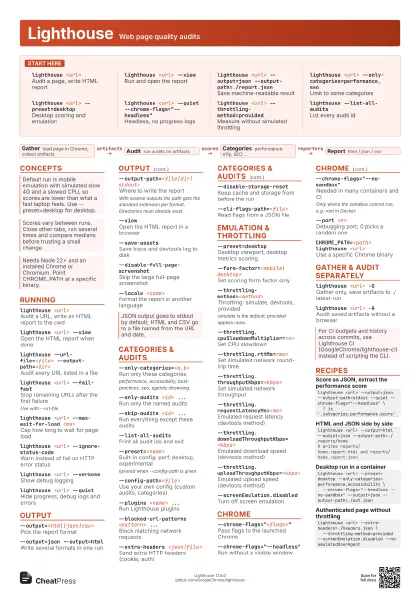
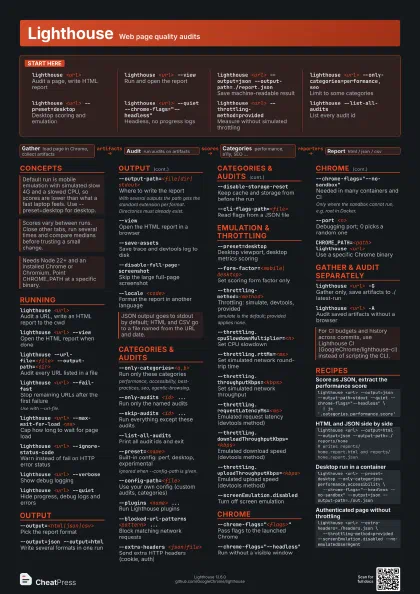
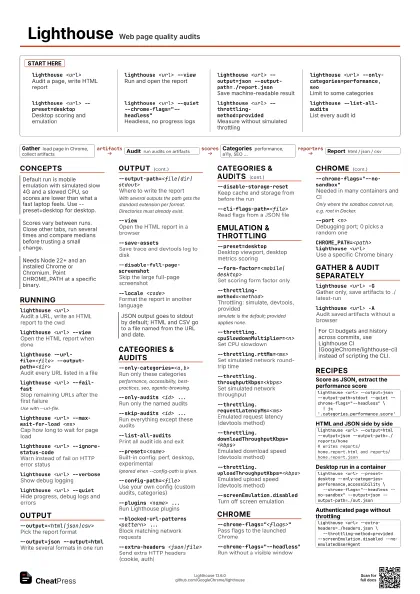
Start here
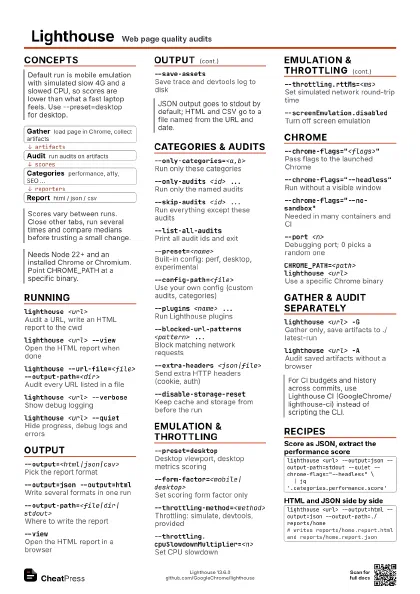
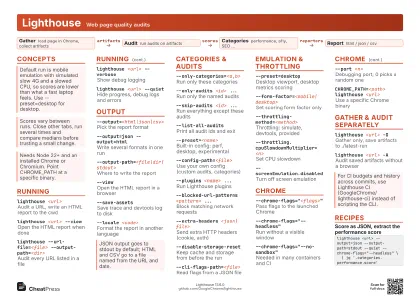
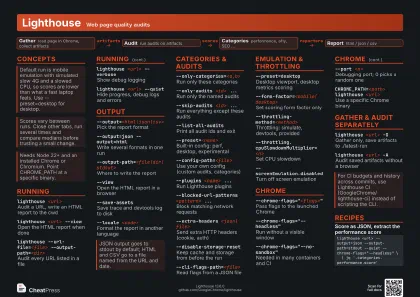
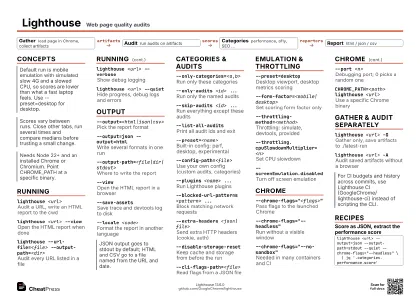
lighthouse <url>
Audit a page, write HTML report
lighthouse <url> --view
Run and open the report
lighthouse <url> --output=json
                    --output-path=./report.json
Save machine-readable result
lighthouse <url>
                    --only-categories=performance,seo
Limit to some categories
lighthouse <url> --preset=desktop
Desktop scoring and emulation
lighthouse <url> --quiet
                    --chrome-flags="--headless"
Headless, no progress logs
lighthouse <url> --throttling-method=provided
Measure without simulated throttling
lighthouse --list-all-audits
List every audit id
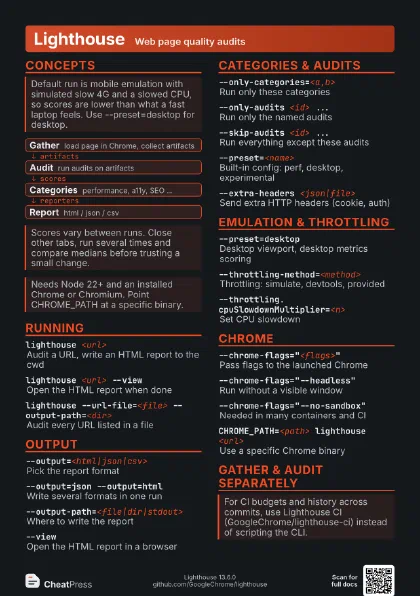
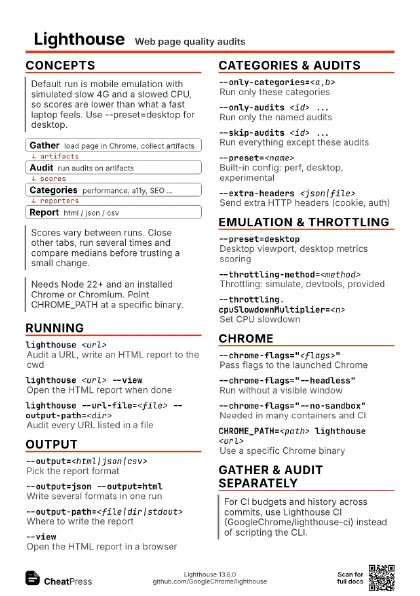
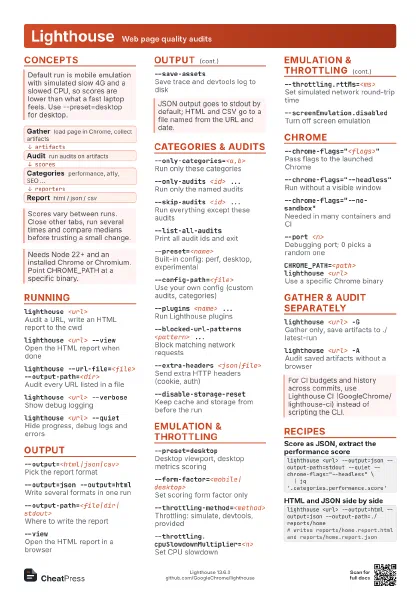
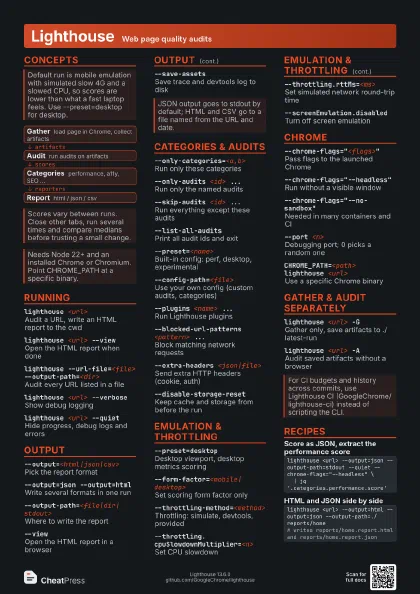
Concepts
- Gather load page in Chrome, collect artifacts
- Audit run audits on artifacts
- Categories performance, a11y, SEO ...
- Report html / json / csv
Running
lighthouse <url>
Audit a URL, write an HTML report to the cwd
lighthouse <url> --view
Open the HTML report when done
lighthouse --url-file=<file>
                    --output-path=<dir>
Audit every URL listed in a file
lighthouse <url> --fail-fast
Stop remaining URLs after the first failure
Use with --url-file.
lighthouse <url> --max-wait-for-load <ms>
Cap how long to wait for page load
lighthouse <url> --ignore-status-code
Warn instead of fail on HTTP error status
lighthouse <url> --verbose
Show debug logging
lighthouse <url> --quiet
Hide progress, debug logs and errors
Output
--output=<html|json|csv>
Pick the report format
--output=json --output=html
Write several formats in one run
--output-path=<file|dir|stdout>
Where to write the report
With several outputs the path gets the standard extension per
format. Directories must already exist.
--viewOpen the HTML report in a browser
--save-assetsSave trace and devtools log to disk
--disable-full-page-screenshot
Skip the large full-page screenshot
--locale <code>
Format the report in another language
--list-localesPrint supported locales
Categories & audits
--only-categories=<a,b>
Run only these categories
performance, accessibility, best-practices, seo,
agentic-browsing.
--only-audits <id> ...
Run only the named audits
--skip-audits <id> ...
Run everything except these audits
--list-all-audits
Print all audit ids and exit
--preset=<name>
Built-in config: perf, desktop, experimental
Ignored when --config-path is given.
--config-path=<file>
Use your own config (custom audits, categories)
--plugins <name> ...
Run Lighthouse plugins
--blocked-url-patterns <pattern> ...
Block matching network requests
--extra-headers <json|file>
Send extra HTTP headers (cookie, auth)
--disable-storage-reset
Keep cache and storage from before the run
--cli-flags-path=<file>
Read flags from a JSON file
Emulation & throttling
--preset=desktop
Desktop viewport, desktop metrics scoring
--form-factor=<mobile|desktop>
Set scoring form factor only
--throttling-method=<method>
Throttling: simulate, devtools, provided
simulate is the default; provided applies none.
--throttling.cpuSlowdownMultiplier=<n>
Set CPU slowdown
--throttling.rttMs=<ms>
Set simulated network round-trip time
--throttling.throughputKbps=<kbps>
Set simulated network throughput
--throttling.requestLatencyMs=<ms>
Emulated request latency (devtools method)
--throttling.downloadThroughputKbps=<kbps>
Emulated download speed (devtools method)
--throttling.uploadThroughputKbps=<kbps>
Emulated upload speed (devtools method)
--screenEmulation.disabled
Turn off screen emulation
--screenEmulation.mobile --screenEmulation.width=<px>
                    --screenEmulation.height=<px>
                    --screenEmulation.deviceScaleFactor=<n>
Custom screen emulation
--emulatedUserAgent <string>
Override the user agent
--no-emulatedUserAgent
Do not override the user agent
Chrome
--chrome-flags="<flags>"
Pass flags to the launched Chrome
--chrome-flags="--headless"
Run without a visible window
--chrome-flags="--no-sandbox"
Needed in many containers and CI
Only where the sandbox cannot run, e.g. root in Docker.
--chrome-flags="--window-size=<w>,<h>"
Launch with a given window size
--port <n>
Debugging port; 0 picks a random one
--hostname <host>
Debugging protocol host
--chrome-ignore-default-flags
Skip Lighthouse's default Chrome flags
CHROME_PATH=<path> lighthouse <url>
Use a specific Chrome binary
Gather & audit separately
lighthouse <url> -G
Gather only, save artifacts to ./latest-run
lighthouse <url> -A
Audit saved artifacts without a browser
lighthouse <url> -GA
Gather and audit explicitly
lighthouse -GA=<dir> <url>
Use a named artifacts folder
--additional-trace-categories <cats>
Add trace categories to the capture
--list-trace-categories
Print required trace categories
--lantern-data-output-path <file>
Write lantern simulation data
--precomputed-lantern-data-path <file>
Reuse lantern data from an earlier run
--enable-error-reporting
Turn error reporting on for this run
Recipes
lighthouse <url> --output=json --output-path=stdout --quiet --chrome-flags="--headless" \ | jq '.categories.performance.score'lighthouse <url> --output=html --output=json --output-path=./reports/home# writes reports/home.report.html and reports/home.report.jsonlighthouse <url> --preset=desktop --only-categories=performance,accessibility \ --chrome-flags="--headless --no-sandbox" --output=json --output-path=./out.jsonlighthouse <url> --extra-headers=./headers.json \ --throttling-method=provided --screenEmulation.disabled --no-emulatedUserAgent