Cheat
gnuplot Plotting from the shell
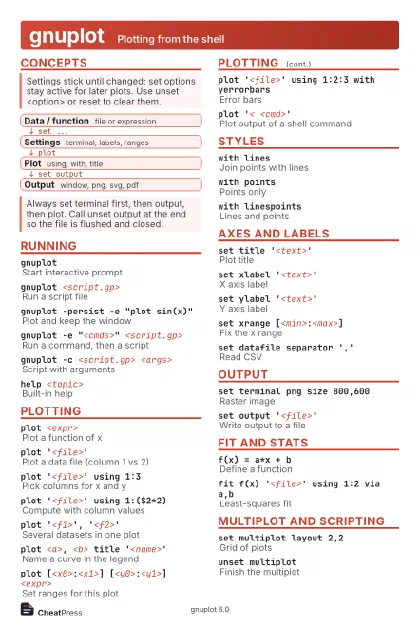 Light · Postcard
102 × 152 mm · PDF
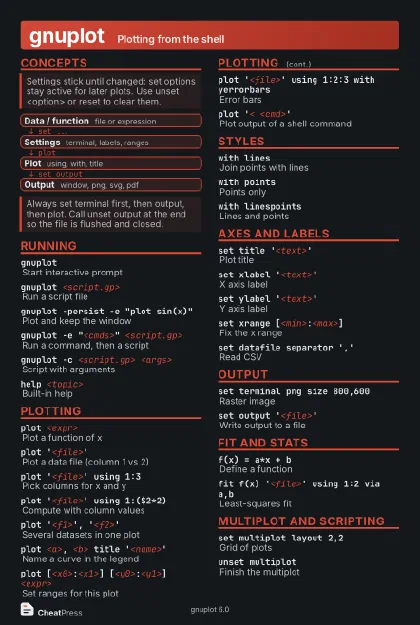 Dark · Postcard
102 × 152 mm · PDF
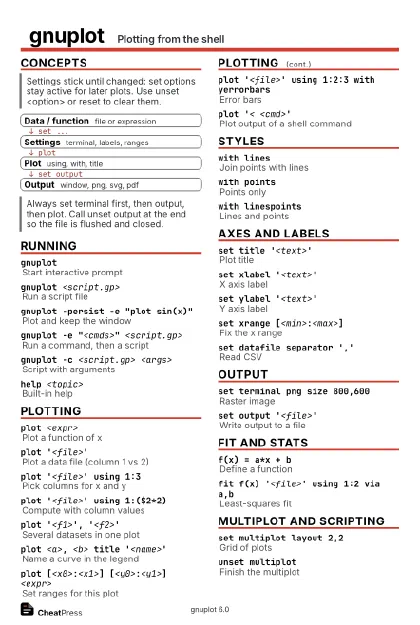 Ink saver · Postcard
102 × 152 mm · PDF
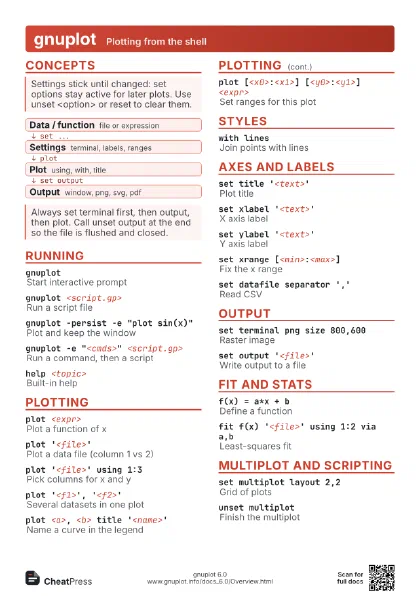
 Light · A4 landscape
297 × 210 mm · PDF
 Dark · A4 landscape
297 × 210 mm · PDF
 Ink saver · A4 landscape
297 × 210 mm · PDF
 Light · A3 landscape
420 × 297 mm · PDF
 Dark · A3 landscape
420 × 297 mm · PDF
 Ink saver · A3 landscape
420 × 297 mm · PDF
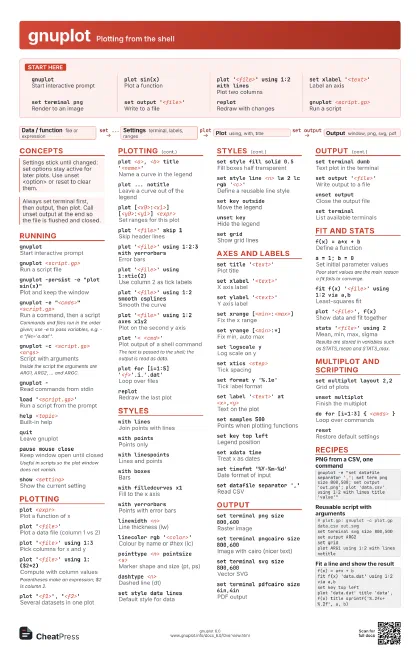

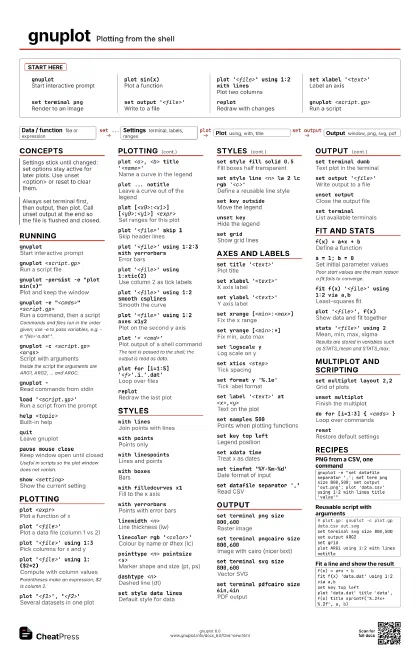
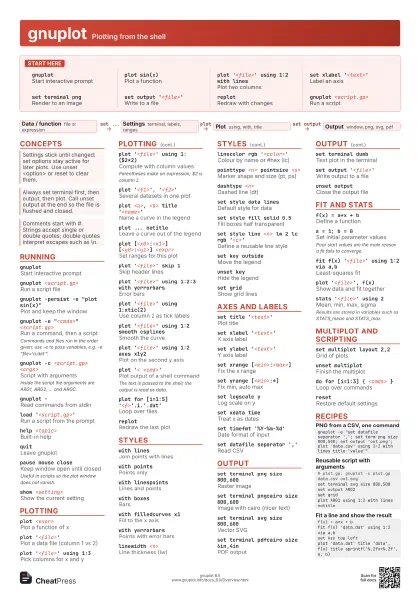
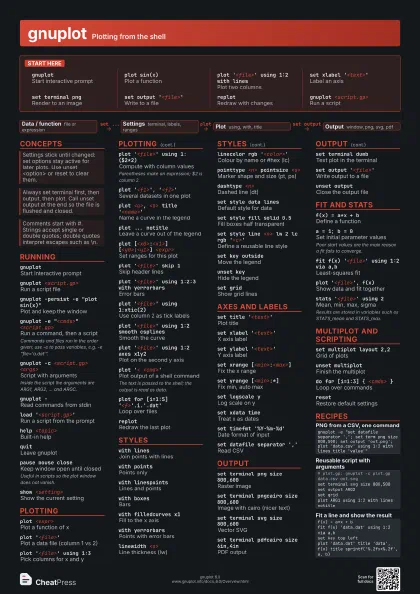
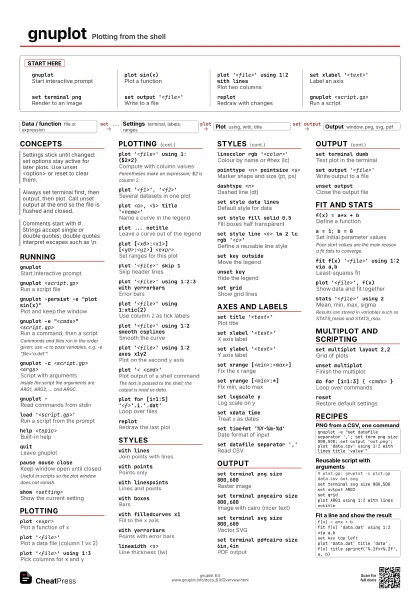
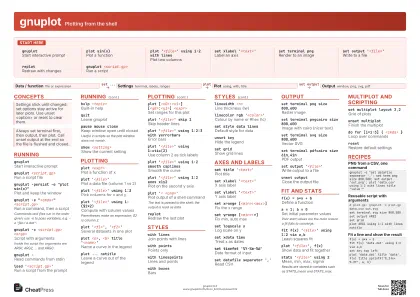
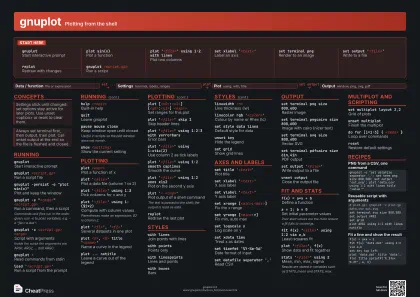
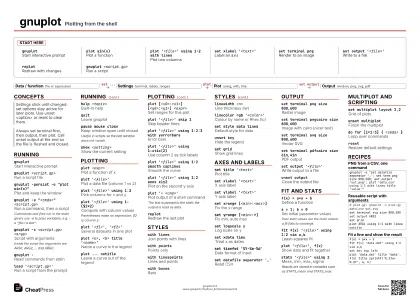
Start here
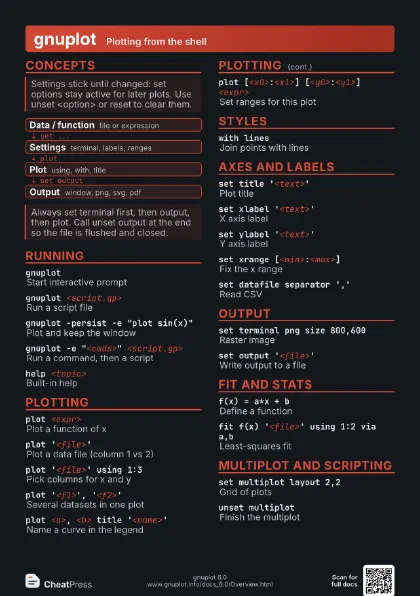
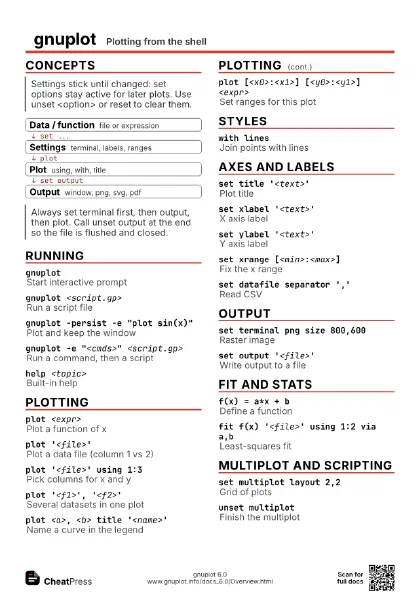
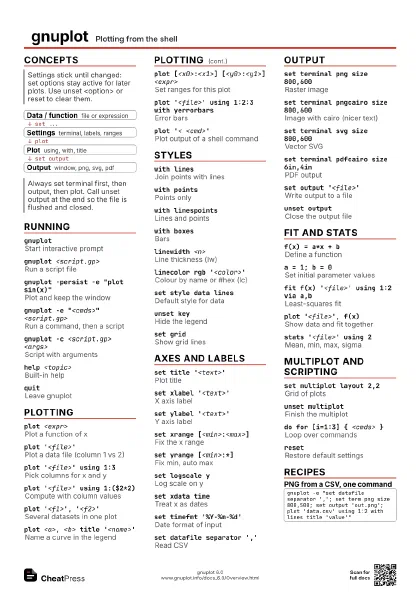
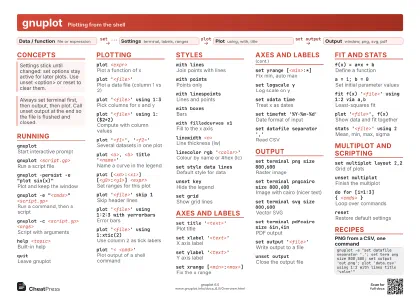
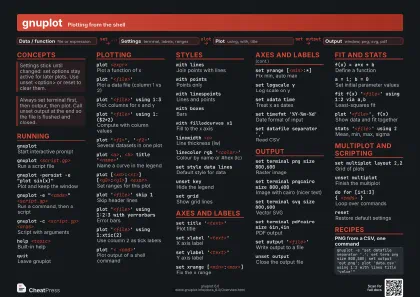
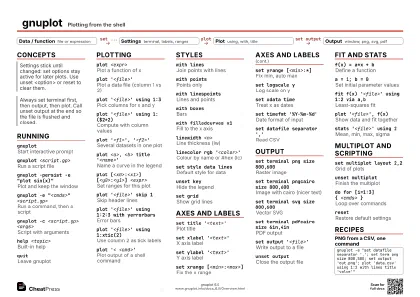
gnuplotStart interactive prompt
plot sin(x)Plot a function
plot '<file>' using 1:2 with lines
Plot two columns
set xlabel '<text>'
Label an axis
set terminal png
Render to an image
set output '<file>'
Write to a file
replotRedraw with changes
gnuplot <script.gp>
Run a script
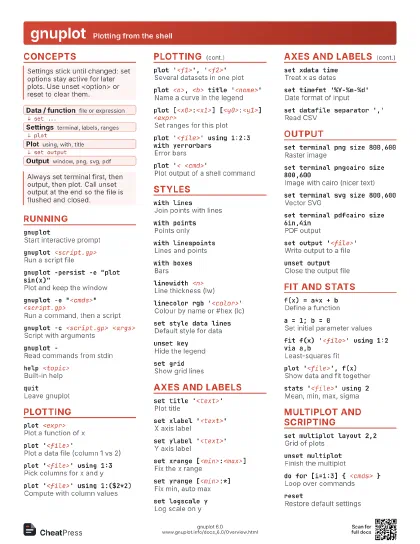
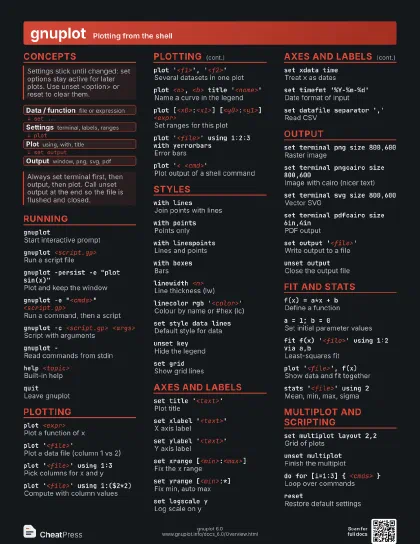
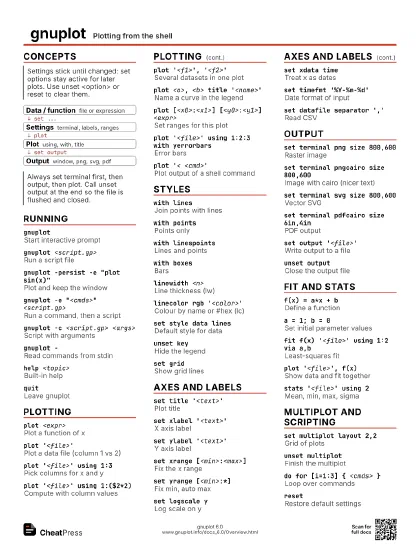
Concepts
- Data / function file or expression
- Settings terminal, labels, ranges
- Plot using, with, title
- Output window, png, svg, pdf
Running
gnuplotStart interactive prompt
gnuplot <script.gp>
Run a script file
gnuplot -persist -e "plot sin(x)"
Plot and keep the window
gnuplot -e "<cmds>" <script.gp>
Run a command, then a script
Commands and files run in the order given; use -e to pass
variables, e.g. -e "file='a.dat'".
gnuplot -c <script.gp> <args>
Script with arguments
Inside the script the arguments are ARG1, ARG2, ... and ARGC.
gnuplot -Read commands from stdin
load '<script.gp>'
Run a script from the prompt
help <topic>
Built-in help
quitLeave gnuplot
pause mouse close
Keep window open until closed
Useful in scripts so the plot window does not vanish.
show <setting>
Show the current setting
Plotting
plot <expr>
Plot a function of x
plot '<file>'
Plot a data file (column 1 vs 2)
plot '<file>' using 1:3
Pick columns for x and y
plot '<file>' using 1:($2*2)
Compute with column values
Parentheses make an expression; $2 is column 2.
plot '<f1>', '<f2>'
Several datasets in one plot
plot <a>, <b> title
                    '<name>'
Name a curve in the legend
plot ... notitle
Leave a curve out of the legend
plot [<x0>:<x1>] [<y0>:<y1>]
                    <expr>
Set ranges for this plot
plot '<file>' skip 1
Skip header lines
plot '<file>' using 1:2:3 with
                    yerrorbars
Error bars
plot '<file>' using 1:xtic(2)
Use column 2 as tick labels
plot '<file>' using 1:2 smooth csplines
Smooth the curve
plot '<file>' using 1:2 axes x1y2
Plot on the second y axis
plot '-'
Read inline data until e
plot '< <cmd>'
Plot output of a shell command
The text is passed to the shell; the output is read as data.
plot for [i=1:5] '<f>'.i.'.dat'
Loop over files
replotRedraw the last plot
Styles
with linesJoin points with lines
with pointsPoints only
with linespoints
Lines and points
with boxesBars
with filledcurves x1
Fill to the x axis
with yerrorbarsPoints with error bars
linewidth <n>
Line thickness (lw)
linecolor rgb '<color>'
Colour by name or #hex (lc)
pointtype <n> pointsize <s>
Marker shape and size (pt, ps)
dashtype <n>
Dashed line (dt)
set style data lines
Default style for data
set style fill solid 0.5
Fill boxes half transparent
set style line <n> lw 2 lc rgb
                    '<c>'
Define a reusable line style
set key outsideMove the legend
unset keyHide the legend
set gridShow grid lines
Axes and labels
set title '<text>'
Plot title
set xlabel '<text>'
X axis label
set ylabel '<text>'
Y axis label
set xrange [<min>:<max>]
Fix the x range
set yrange [<min>:*]
Fix min, auto max
set logscale yLog scale on y
set xtics <step>
Tick spacing
set format y '%.1e'
Tick label format
set label '<text>' at
                    <x>,<y>
Text on the plot
set samples 500Points when plotting functions
set key top left
Legend position
set xdata timeTreat x as dates
set timefmt '%Y-%m-%d'
Date format of input
set datafile separator ','
Read CSV
Output
set terminal png size 800,600
Raster image
set terminal pngcairo size 800,600
Image with cairo (nicer text)
set terminal svg size 800,600
Vector SVG
set terminal pdfcairo size 6in,4in
PDF output
set terminal dumb
Text plot in the terminal
set output '<file>'
Write output to a file
unset outputClose the output file
set terminalList available terminals
set term pdfcairo; set output '<f>';
                    replot
Re-save the current plot
Fit and stats
f(x) = a*x + b
Define a function
a = 1; b = 0Set initial parameter values
Poor start values are the main reason a fit fails to converge.
fit f(x) '<file>' using 1:2 via a,b
Least-squares fit
fit [<x0>:<x1>] f(x) '<file>' via
                    a,b
Fit a range only
fit f(x) '<file>' using 1:2:3 yerror via
                    a,b
Weighted by errors
plot '<file>', f(x)
Show data and fit together
stats '<file>' using 2
Mean, min, max, sigma
Results are stored in variables such as STATS_mean and
STATS_max.
Multiplot and scripting
set multiplot layout 2,2
Grid of plots
unset multiplotFinish the multiplot
set origin <x>,<y>; set size
                    <w>,<h>
Place a plot by hand
do for [i=1:3] { <cmds> }
Loop over commands
<var> = '<value>'
String variable
$<name> << EOD
Inline data block
End the block with EOD on its own line; then plot $name.
resetRestore default settings
Recipes
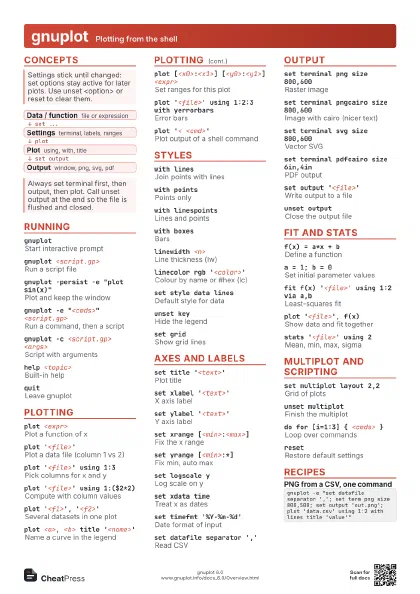
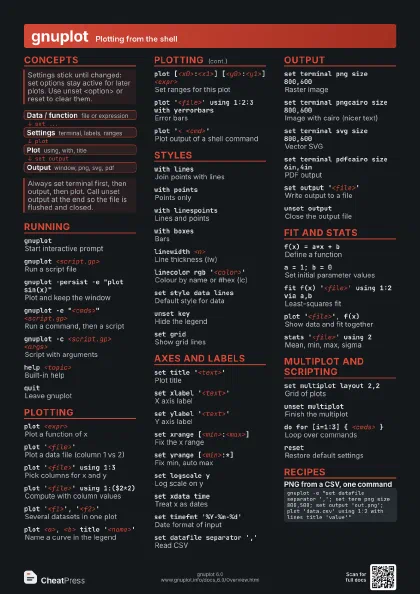
gnuplot -e "set datafile separator ','; set term png size 800,500; set output 'out.png'; plot 'data.csv' using 1:2 with lines title 'value'"# plot.gp: gnuplot -c plot.gp data.csv out.svgset terminal svg size 800,500set output ARG2set gridplot ARG1 using 1:2 with lines notitlef(x) = a*x + bfit f(x) 'data.dat' using 1:2 via a,bset key top leftplot 'data.dat' title 'data', f(x) title sprintf('%.2fx+%.2f', a, b)awk '{print $1, $3}' log.txt | gnuplot -persist -e "plot '-' with lines"set terminal pngcairo size 900,500set output 'two.png'set multiplot layout 1,2plot sin(x)plot cos(x)unset multiplotunset output